May 15, 2010 | Uncategorized
An Excerpt from the Timely Trades Letter.
Volume patterns have an important effect on many trading systems. Volume measures the interest in a move, it shows how many people are interested in the current price pattern and how they are voting with real money. Rather than listen to the talking heads on the business channels discuss their opinions of what is going on, it is better to look at the volume patterns and see what people are actually doing with their money.
Serious traders will go through a learning curve as they study market behavior and how their trading systems function. They will have times when they run into situations that have not been experienced or researched and they may be unsure of what to do. This is normal, it is the price of admission to the trading business. My general rule is that when I am unsure I close the position. It is hard to go broke taking profits so my focus is on needing a clear reason to stay in a position, not wondering whether or not I should get out. If there is no clear reason to hold I take profits and move on to another trade.
When trading I am not holding out for the perfect trade, there is no such thing. Trading is about managing risks and I use the current market conditions to determine how many trades to be taking and the appropriate position sizing to use. Setups with more room to run are prioritized above ones with little room to run. Setups triggering on stronger volume compared to the previous days volume are prioritized above ones with lower trigger day volume. Setups with shallower pullbacks are prioritized above ones with deeper pullbacks. I then look at the setups that are triggering andstart from the top of the prioritized list and work down until I run out of setups or fill the number of positions I am interested in.
When I go to a trading conference I often ask how many traders are bullish, a number of hands go up. I then ask how many traders are bearish and more hands go up. I then ask how many traders do not care if the market is bullish or bearish, this usually generates some chuckles and a couple of hands. The serious traders do not care whether the market is going up or down, they know it is out of their control and they have tools to deal with both conditions so it does not matter. The traders laughing at this question usually have interesting stories of significant drawdowns from guessing incorrectly. Try not to be bullish or bearish, just focus on where the markets key trend lines and support/resistance levels are and adapt to what the market is actually doing.
Sometimes I will see traders trading weaker patterns because they have had a good winning streak and are ‘using the house’s money’. Nonsense, profits are yours there is no house. Each trade must stand on it’s own. Do not be tempted to trade weaker patterns after a winning streak. Stick to what works. Dance with the one that brought you.
Sometimes traders will start trading more aggressively when they are down in an attempt to get back to even. Draw downs are a fact of life in trading. Trading is not like drawing a paycheck. You do not get paid because it is Friday. I research the systems and then use that information when trading. If I have a losing streak I know that is to be expected and just stay focused on using the knowledge and skills that come from fully testing and analyzing trading systems.
Steve Palmquist a full time trader who invests his own money
in the market every day. He has shared trading techniques and
systems at seminars across the country; presented at the Traders
Expo, and published articles in Stocks & Commodities, Traders-
Journal, The Opening Bell, and Working Money. Steve is the author of,
“Money-Making Candlestick Patterns, Backtested for Proven Results’,
in which he shares backtesting research on popular candlestick
patterns and shows what actually works, and what does not. Steve
is the publisher of the, ‘Timely Trades Letter’ in which he shares
his market analysis and specific trading setups for stocks and ETFs.
To receive a sample of the ‘Timely Trades Letter’ send an email to sample@daisydogger.com. Steve’s website:www.daisydogger.com
provides additional trading information and market adaptive trading
techniques.
May 12, 2010 | Uncategorized
When the market is falling and the charts look terrible, your emotions want you to sell. Conversely, when the market is rallying and the news is good, your emotions want you to buy. Unfortunately, this can lead to selling at the low or buying at the high. One way of controlling your emotions is to set some market timing rules based on AIQ’s US score, a unique indicator that can be found on the Market Log report.
While the Expert Ratings on an individual stock can be suspect, the Expert Ratings taken from a large database of stocks are more effective in classifying the health of the market. That is, when a lot of stocks are giving AIQ Expert Rating buy signals, a market rally may be near. Conversely, when a large number of stocks are giving AIQ sell signals, a market decline may be approaching. Expert Ratings are either confirmed” or “unconfirmed.” A confirmed buy signal occurs when a stock has a recent Expert Rating up signal of 95 or greater along with an increasing Phase indicator. The opposite is true for confirmed sell signals. Unconfirmed signals, however, occur when there is an Expert Rating of 95 or greater but the Phase indicator fails to move in the direction of the signal. It is the unconfirmed signals that you should be interested in.
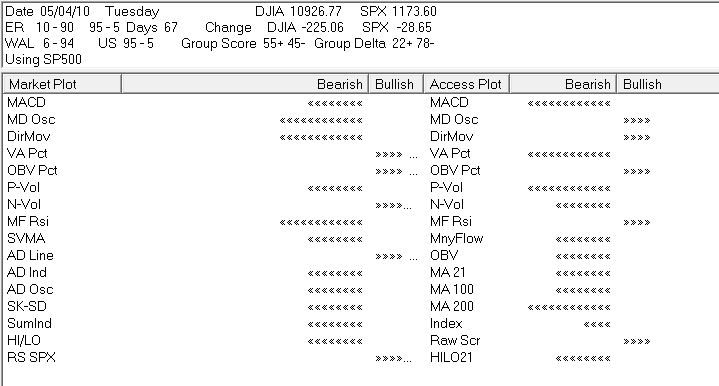
AIQ’s Market Log report lists the percentage of stocks giving unconfirmed signals (US). The US score is found near the top of the report (Figure 1). The percentage of stocks giving unconfirmed AIQ buy signals appears to the left of the hyphen and the percentage of stocks giving unconfirmed AIQ sell signals appears on the right side of the hyphen. In the image below we see that of the stocks giving unconfirmed signals, 95% are on the buy side and 5% are on the sell side. To open the Market Log report, go to Reports and double-click Summary Reports and then Market Log. I run the Market Log report on the S&P 500 database.
It is important to keep in mind that AIQ Expert Ratings fire against the trend. As the market declines, the percentage of stocks giving unconfirmed AIQ buy signals increases. As the market rallies, few stocks give buy signals and more stocks register sell signals.
The US score serves as an overbought/oversold indicator for the market. That is, when the US score 85% or more on the buy side, then that implies the market has recently experienced a sharp decline, is oversold, and due for a rally. Conversely, when the US score shows 85% or more on the sell side, then the market has rallied and is overbought.
Some AIQ users immediately enter the market when the US score moves to 85% or more on the buy side. They exit anytime the US score is 85% or more on the sell side. I don’t recommend this approach because the market can stay overbought or oversold for quite some time. Instead, it may be best to wait for a trend-following indicator such as the Directional Movement Index to confirm the new trend direction.
Rather than using the US score as a strict market timing model, use it as a simple tool to keep your emotions in check. It helps you avoid buying high or selling low. Here is the rule: Don’t turn bearish on the market and sell positions when the US score shows 85% or more buy signals. Similarly, never turn bullish or add positions when the US score shows 85% or more sell signals. This rule sounds simple but your emotions will tell you otherwise. When the US score has a high percentage of buy signals, the market has fallen and news reports are gloomy. That’s when your emotions tell you to bail. You may be selling right at a low, however. You either should have already sold or you should wait until the market rallies enough to where the US score is no longer giving a bullish reading.
When the market rallies it gets easier to buy. News reports are better and you think you may miss a big rally if you don’t immediately buy. Your emotions tell you to buy more but the US score can counteract your emotions. Don’t buy until the market pulls back enough to bring the US score out of bearish territory. Preferably, wait until the US score turns bullish Monitoring the US score on a daily basis gives you a good indication of the market’s health. It helps to control your emotions because it turns more bullish as the market falls and it turns more bearish as the market rises.
.
May 12, 2010 | Uncategorized
When the market is falling and the charts look terrible, your emotions want you to sell. Conversely, when the market is rallying and the news is good, your emotions want you to buy. Unfortunately, this can lead to selling at the low or buying at the high. One way of controlling your emotions is to set some market timing rules based on AIQ’s US score, a unique indicator that can be found on the Market Log report.
While the Expert Ratings on an individual stock can be suspect, the Expert Ratings taken from a large database of stocks are more effective in classifying the health of the market. That is, when a lot of stocks are giving AIQ Expert Rating buy signals, a market rally may be near. Conversely, when a large number of stocks are giving AIQ sell signals, a market decline may be approaching. Expert Ratings are either confirmed” or “unconfirmed.” A confirmed buy signal occurs when a stock has a recent Expert Rating up signal of 95 or greater along with an increasing Phase indicator. The opposite is true for confirmed sell signals. Unconfirmed signals, however, occur when there is an Expert Rating of 95 or greater but the Phase indicator fails to move in the direction of the signal. It is the unconfirmed signals that you should be interested in.
AIQ’s Market Log report lists the percentage of stocks giving unconfirmed signals (US). The US score is found near the top of the report (Figure 1). The percentage of stocks giving unconfirmed AIQ buy signals appears to the left of the hyphen and the percentage of stocks giving unconfirmed AIQ sell signals appears on the right side of the hyphen. In the image below we see that of the stocks giving unconfirmed signals, 95% are on the buy side and 5% are on the sell side. To open the Market Log report, go to Reports and double-click Summary Reports and then Market Log. I run the Market Log report on the S&P 500 database.
It is important to keep in mind that AIQ Expert Ratings fire against the trend. As the market declines, the percentage of stocks giving unconfirmed AIQ buy signals increases. As the market rallies, few stocks give buy signals and more stocks register sell signals.
The US score serves as an overbought/oversold indicator for the market. That is, when the US score 85% or more on the buy side, then that implies the market has recently experienced a sharp decline, is oversold, and due for a rally. Conversely, when the US score shows 85% or more on the sell side, then the market has rallied and is overbought.
Some AIQ users immediately enter the market when the US score moves to 85% or more on the buy side. They exit anytime the US score is 85% or more on the sell side. I don’t recommend this approach because the market can stay overbought or oversold for quite some time. Instead, it may be best to wait for a trend-following indicator such as the Directional Movement Index to confirm the new trend direction.
Rather than using the US score as a strict market timing model, use it as a simple tool to keep your emotions in check. It helps you avoid buying high or selling low. Here is the rule: Don’t turn bearish on the market and sell positions when the US score shows 85% or more buy signals. Similarly, never turn bullish or add positions when the US score shows 85% or more sell signals. This rule sounds simple but your emotions will tell you otherwise. When the US score has a high percentage of buy signals, the market has fallen and news reports are gloomy. That’s when your emotions tell you to bail. You may be selling right at a low, however. You either should have already sold or you should wait until the market rallies enough to where the US score is no longer giving a bullish reading.
When the market rallies it gets easier to buy. News reports are better and you think you may miss a big rally if you don’t immediately buy. Your emotions tell you to buy more but the US score can counteract your emotions. Don’t buy until the market pulls back enough to bring the US score out of bearish territory. Preferably, wait until the US score turns bullish Monitoring the US score on a daily basis gives you a good indication of the market’s health. It helps to control your emotions because it turns more bullish as the market falls and it turns more bearish as the market rises.
.
May 4, 2010 | Uncategorized
In addition to standard tools, AIQ TradingExpert Pro has some unique features that nearly every user would find beneficial. In this article, we’ll demonstrate the benefits of creating industry groups specific to your trading needs.
TradingExpert comes with two industry group structures, the Standard & Poor’s structure and the AIQALL structure. The software also has the ability to create new industry group structures. Those who use standard analysis tools may think creating industry groups is unimportant, but we’ll show that almost every user can benefit from AIQ’s industry group tools.People who perform a top-down analysis obviously find AIQ’s group analysis capabilities very important. These people first analyze industry sectors and groups and then pick stocks within the attractive groups.
Most people, however, are bottomup traders. They screen a broad database of stocks trying to find attractive trades. The group analysis feature in TradingExpert Pro is important for bottom-up traders as well.
By creating AIQ groups you can crate your own index and control which stocks comprise the index and you can see volume data calculated from the stocks in the index. A similar analysis can be done on the stocks in your portfolio. By creating a group of the stocks your trading system selects, you can see when the system outperforms the market indexes and when the system struggles. It helps tell you when you want to be active in your trading and when you should sit on the sidelines.
Groups can also be created to track mutual funds. By creating industry groups based on the 10 largest stock holdings of the mutual funds, one can analyze these surrogate groups using both price and volume-based indicators.
To create a surrogate mutual fund group, first build a list of the 10 stocks and then create an index for this group of tickers.
Step 1. Create a list name. In the Data Manager, click List and then New. Enter a list name and click OK.
Step 2. Create a group ticker. In Data Manager, click Ticker and New. Enter a ticker for the new group. Make sure the ticker symbol isn’t the same as an existing stock’s symbol. Click Group and then OK. Drag the group name to the left side of the Data Manager and drop it on the list name.
Step 3. Enter the stock symbols that comprise the group. In the panel on left side of the Data Manager window, single-click on the group ticker symbol which appears just below the list name. With the ticker highlighted, click List and Insert Tickers. Enter the ticker symbols that you want in the group separated by semicolons.
The next time you download data, indices for the groups will automatically be calculated. You can also calculate the groups by going to the Data Manager and clicking Utilities and Compute Group/Sector Indices. Highlight the list name and click OK. I repeat, having the ability to create industry groups or an industry group structure for your specific needs is a valuable tool for AIQ users. Whether you use the group feature to spot the rotation of industry groups or whether you use the feature to track the performance of a set of stocks, performing group analysis helps you to better understand the market environment.
Apr 23, 2010 | Uncategorized
An advantage of chart pattern analysis is that it is always valid. Mechanical trading systems and indicator readings gain and lose their effectiveness over time but proper chart analysis remains consistent. Chart pattern analysis is subjective, however, so practice helps to achieve reliability. Chart patterns do not call market tops or bottoms. In each chart, the analyst waits for a sign, such as a trendline break, to indicate that the trend has actually reversed. Instead of calling tops or bottoms, pattern analysis gives an early indication as to when a new trend has emerged.
In this article, we will cover four important chart patterns – the Rectangle, Right Triangle, Wedge, and Symmetrical Triangle.
Rectangle Pattern
A Rectangle pattern is formed when a security fluctuates back and forth in a narrow range. One horizontal line is drawn connecting the highs and another horizontal line is drawn connecting the lows. The upper trendline represents resistance and the lower trendline represents support. The more times a trendline is touched and a reversal occurs, the more powerful its support or resistance becomes. When a Rectangle pattern is forming, the security is often said to be consolidating, or in a trading range.
The direction of the breakout from this pattern cannot be predicted. On the bet that the pattern will continue intact, short-term traders can enter long positions when the security is near its lower support line and enter short positions when the security is near its upper resistance line. Stops are placed just outside the pattern. Most traders, however, wait for the eventual breakout from the pattern. Typically, the longer the security remains in the pattern, the bigger the move after the breakout. Ideally, the breakout comes with heavy volume.
In the image below, beginning in the summer 2002, the market stopped falling and a Rectangle pattern was formed.Trendlines are drawn at the upper and lower extremes of the price range.
Right Triangle Pattern
The Right Triangle is a pattern that exhibits a series of narrower price fluctuations. On one side of the fluctuation, the boundary of price action is horizontal. The boundary on the other side slopes toward the opposite (horizontal) boundary. An Ascending Triangle is a Right Triangle with a horizontal top and an ascending bottom. A Descending Triangle is the reverse.
In most cases, it is the horizontal trendline that is broken in this pattern. Therefore, caution should be exercised when a Descending Triangle is developing. Likewise, be ready to buy long when an Ascending Triangle is developing. If the security breaks the sloping trendline instead of the horizontal trendline, then the resulting move has less significance. If the downward sloping trendline on a Descending Triangle is broken, the stock may only rally to its previous reaction high.
The image below shows a daily chart of the Dow and an Ascending Triangle pattern. Notice the four occasions where the high point on the Dow touched the upper trendline but failed to break through it. Each sell-off, however, was less than the previous sell-off. Since this is an Ascending Triangle, this suggests the eventual break will be to the upside. In fact, that’s what happened.
Unfortunately there are false breakouts where a breakout occurs but the security reverses direction and heads lower. When this happens, the upward sloping trendline can work as a good stop loss. If the security crosses this trendline, positions can be closed.
Wedge Pattern
A Wedge is a pattern bounded by trendlines that are not parallel and that both slope in the direction of the overall trend. The range of the price fluctuation narrows as price approaches the point where the trendlines intersect. Wedges are typically formed after a strong upward or downward move. For a stock in an uptrend, a break below the Wedge means the security should begin a sideways consolidation or move lower. The opposite is true for a downtrending stock. Ideally, volume dries up when the security is in the Wedge and then the breakout occurs on heavy volume.
The image below shows the S&P 500 with a Wedge pattern. Since this is an upward sloping Wedge, the pattern is fulfilled when the lower support trendline is broken. That happened on May 19.
Symmetrical Triangle Pattern
Whereas the Right Triangle has one horizontal trendline and one sloping trendline, the Symmetrical Triangle pattern has two sloping trendlines that form two sides of the triangle. Since they slope in opposite directions, the trendlines intersect somewhere around the middle of the existing price range. That is, the price fluctuates up and down but each move is smaller than its predecessor.
The descending tops in the price movement are defined by a downward sloping boundary line (resistance line) and the low points in the fluctuation are defined by an upward sloping line (support line). The upper and lower lines need not be of equal length.
The image below shows the S&P 500 02/17/09, the day the index broke below the symmetrical pattern. Each rally was less than the previous rally and each decline was less than the previous decline. The S&P 500 eventually fell below its support. The pattern turned bearish and the market continued to fall.
We’ve shown several important chart patterns covering recent market activity. Our examples use weekly, daily, and real-time charts. The length of the chart is significant. A completed pattern on a weekly chart implies a long-term move while a pattern on a real-time chart may forecast a move that will last only part of that trading day.
All of our examples use market indexes. The same patterns work for stocks as well as other traded securities.