Mar 3, 2011 | Uncategorized
Steve Palmquist
Author of ‘The Timely Trades Letter’. ‘How to Take Money from the Markets’, and Money-Making Candlestick Patterns.
During 20 years of active trading experience I have researched, tested, and analyzed a number of trading systems and techniques. Some have shown promising results, some do not. I add tools to my trading toolbox based on their effectiveness. Trading systems are not effective because Aunt Millie or uncle Bob told you about them, they are effective because they work. Most trading systems, are affected by market conditions, volume patterns, and other factors. Using a trading technique that has not been analyzed in different market conditions, or failing to match trading techniques to the current market environment is asking for trouble.
Making money in the stock market requires knowledge of what to trade, when to trade, and a variety of trading tools designed for different market conditions. Just as a carpenter will use several different tools when building a house, traders will use different tools to build their account. Using the same trading tool in all situations is like trying to build a house with just a hammer. Carpenters have tools designed for specific jobs, and so should traders.
The successful trader has a tool box with a variety of trading tools for use in different market conditions. The trader, like the carpenter, must go beyond just acquiring the tools. Traders must understand which tool to use for a specific task, and have a clear understanding of how the tool works, and what can and cannot be done with it. Some tools, like a screwdriver, are fairly easy to learn how to use. Other tools, like a table saw, require a lot more training and experience to get the most out of. Most carpenters serve an apprentice period where they work with, and learn from, someone with years of experience. It is amazing how many people will just start trading their hard earned money without ‘learning the trade’ first.
The more traders understand exactly how and when their trading patterns work, the more effective use they will be able to make of each tool in the trading toolbox. Back testing does not guarantee future results. There are no guarantees in trading, and no way to know if any particular trade will be profitable or not. Backtesting helps remove some of the emotion, hunches, and unknowns in trading. It can show you how a particular system has performed in different market conditions in the past and what types of filters may be most interesting in prioritizing trading opportunities. Examples of six complete trading systems and how they perform in different market conditions is covered in ‘How to Take Money from the Markets’

Steve is the author of two trading books: “Money-Making Candlestick Patterns, Backtested for Proven Results’, in which he shares backtesting research on popular candlestick patterns and shows what actually works, and what does not.
“How to Take Money From the Markets, Creating Profitable Trading Strategies” in which he uses the results of extensive backtesting techniques to smash trading myths and get to the truth of what has worked and what has not. The book provides six fully analyzed and tested trading systems and shows how they have performed in different market conditions.
Steve is the publisher of the, ‘Timely Trades Letter’ in which he shares his market analysis and specific trading setups for stocks and ETFs. To receive a sample of the ‘Timely Trades Letter’ send an email to sample@daisydogger.com. Steve’s website:www.daisydogger.com provides additional trading information and market adaptive trading techniques.
Mar 2, 2011 | Uncategorized
The SAR in this indicator stands for stop and reverse. That means that with this indicator you are always in the market. You simply reverse the position when the stop level is reached. When you are on a buy mode and the stop is reached, then you switch to a sell (or short) mode. If you are on a sell mode and the indicator turns bullish, then you switch to a buy mode.
To see the Parabolic SAR indicator in the TradingExpert system, open a stock chart and click the ParaSAR indicator in the Control Panel. Since this indicator overlays the stock price chart, it is found in the upper half of the Control Panel. The Parabolic SAR indicator is shown in the chart below. The indicator gets its name from the shape assumed by the trailing stops that tend to curve like a parabola. Dots below prices indicate a long position while dots above the prices indicate a short position. The dots represent the stop and reverse points.
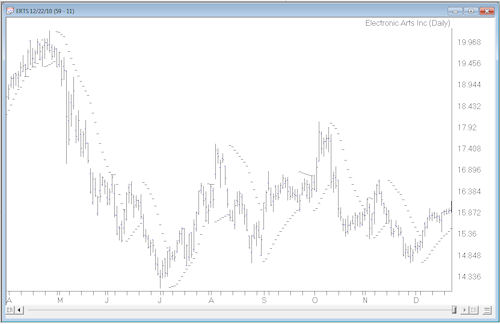
As the prices move higher, the rising dots below the price action tend to start out slow and then accelerate with the trend. The slow start in the indicator allows a trend to take place. As the stock moves higher, there is an acceleration factor and the indicator moves faster until it catches up to price action. The same is true for stocks that are falling. This is a trend following indicator so it obviously works best on volatile stocks that are in trends. Even on trending stocks, there will be whipsaws.
For short-term swing traders who deal with volatile stocks such as those found on the Nasdaq, the Parabolic SAR indicator may help improve entry and exit points.
Feb 9, 2011 | Uncategorized
by Dan Valcu, CFTe
This indicator is a very old statistical tool that even to this day helps determine trend strength and turning points. Here’s how to apply it to your trading.
Technical analysis can be considered both a science and an art; patterns and chart reading represent the artistic component, while technical indicators help us analytically understand trend strength, buy/sell pressure, and divergences. There are perhaps thousands of technical indicators, but few seem to deliver real analytical power and differentiation in this increasingly crowded landscape, especially since many can be perceived simply as intellectual exercises that produce little bottom-line impact.
To narrow down this set of tools, statistics offer a great source of established knowledge for those who want to focus on more tangible and useful indicators. For instance, the tried-and-tested Z-score has become a classic in both statistics and technical analysis.
In this article we will discuss an established concept in statistics originally proposed in 1904, with potential for use in technical analysis: the Spearman’s rank correlation coefficient, also known as the Spearman indicator. Article extract courtesy Stocks & Commodities magazine
The AIQ code for the Qstick and the Psychological Indicators as mentioned in Dan Valcu’s article, “The Spearman Indicator for Technical Analysis”available from TradersEdgeSystems courtesy of Rich Denning
Jan 31, 2011 | Uncategorized
Every trading day, the price of a stock is determined by a struggle between supply and demand. In technical analysis, charting a security is critical because it shows the interaction of supply and demand. The demand fluctuates at any given moment from a variety of factors, some rational and some irrational.
As a stock enters into a period of fluctuation, one of several traditional chart patterns may emerge. The pattern we’ll focus on in this article is the Symmetrical Triangle.
The Symmetrical Triangle pattern has two sloping trendlines that converge to each other. That is, a stock fluctuates up and down but each move is smaller than its predecessor. The descending tops in the price movement are defined by a downward sloping boundary line (resistance line) and the low points in the fluctuation can be defined by an upward sloping line (support line). The top and bottom boundaries need not be of equal length.
With the Symmetrical Triangle pattern, it’s seldom that a clue is given on the chart indicating which direction will eventually be broken. This is an attractive pattern for day-traders. That’s because good tradable moves come after a period of reduced volatility and because the pattern lends itself to tight stops. I’ll explain with an example. The chart below shows a one-minute chart of the S&P 500 Notice that after rallying in the morning, the S&P 500 stalls and begins to move sideways. In the 11:00 hour the index enters the Symmetrical Triangle pattern. Each rally is less than the previous rally and each decline is less than the previous decline.
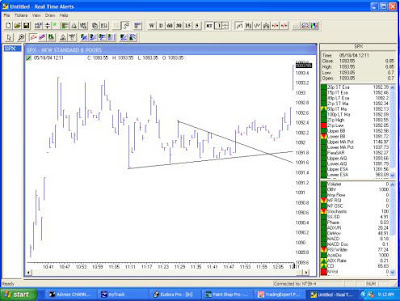
As the pattern develops, volatility falls. The eventual break came to the upside. After the break, investors had several minutes to act on the signal before the S&P 500 jumped higher. Once the pattern is broken, a tight stop can be placed using trendlines. In this case, the break was to the upside so the stop is placed just below the support trendline (lower trendline). If the break occurred to the downside, the stop would be placed just above the resistance trendline.
Realtime Point & Figure charts can help identify this pattern. Unlike bar charts where the vertical coordinate is based on price and the horizontal coordinate is based on time, the Point and Figure chart is only concerned with price. Since time is not a factor, small fluctuations in price are often not charted. Without these disturbances, it is easier to spot emerging patterns.
The figure below shows the S&;P 500’s Point & Figure chart using the same date as the first chart. The Symmetrical Triangle is seen at the very end of the pattern.
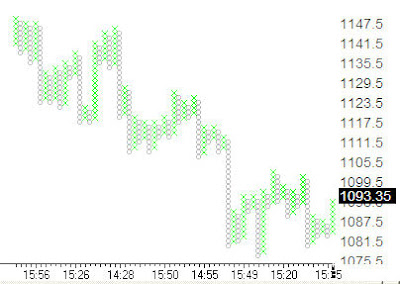
Looking at the last five columns, each rally (the Xs in the chart) is less than or equal to the previous rally and each decline (the Os in the chart) is greater than or equal to the previous decline. In this chart I elected to have a small box size (1.5 S&P 500 points per box) to make the chart more responsive and appropriate for active trading. It is also the reason behind the small Xs and Os. By increasing the box size, the Xs and Os will appear larger on the monitor.
The figure below shows Bed Bath & Beyond (BBBY) using a $0.20 box size. The larger Xs and Os make it easy to spot the Symmetrical Triangle pattern.
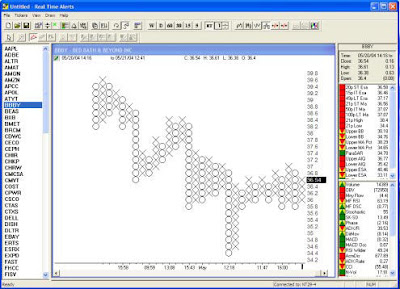
In the center of the pattern, BBBY enters a period where each rally is less than the previous rally and each sell-off is less than the previous sell-off. The bearish signal came once BBBY fell below the pattern and the column of Os fell below the previous column of Os. The Symmetrical Triangle pattern is an attractive pattern for active traders because tradeable moves often come after periods of reduced volatility and because the pattern allows for time stops. You can identify the pattern using traditional bar charts or with the real-time Point & Figure charts. Most people find it is easier to identify the pattern using the Point & Figure technique.
Jan 14, 2011 | Uncategorized
My very special guest, Adrienne Toghraie joined us today for an excellent presentation on ‘Modeling Success Qualities of Top Traders’
Adrienne, founder of TradingonTarget and author of 12 books, is an expert on coaching traders and investors to their next level of success by helping them overcome their self-imposed limitations.
This Webinar-workshop was about learning the qualities you need to acquire for running a successful trading business in order to become a master trader. Here are the categories Adrienne discussed:
• Entrepreneur Qualities
• Trader Qualities
• Emotional Stability Qualities
• People Skill Qualities
• Mastery Qualities
Many of you have busy schedules and some missed out on the event, however we have recorded the entire event and it’s available for you to view at
http://prowebinars.na5.acrobat.com/p36555229/
We look forward to seeing you at our next scheduled event on Januuary 26, 2011. I will be presenting ‘How to test a trading strategy using a systematic approach’.
Register now at http://tradingontarget.omnovia.com/registration/pid=51731291740818
Jan 3, 2011 | Uncategorized
Stocks & Commodities Magazine Traders Tips – January 2011 “Combining RSI with RSI” by Peter Konner
Optimization and stop-losses can help you minimize risks and give you better returns.
You would like to be long in a market that’s trending up, but what about when the trend turns down? Do you exit and just watch from the sidelines, or do you try to trade on the corrections in the downtrend? Here’s a simple combination where you can trade long-term uptrends and short-term corrections, all in one chart.
One of my previous strategies didn’t allow me to enter a trade and stay there in a long and strong uptrend, since the strategy was designed to use the relative strength index (Rsi) on a daily basis. The total return from my Rsi strategy was fair, but there were many trades with little return, especially in volatile markets.
I decided to build a new strategy with these requirements……read more at http://www.traders.com/Documentation/FEEDbk_Docs/2011/01/Konner.html
Rich Denning has coded this indicator for AIQ EDS, you can pick up the code from Rich’s website at http://www.tradersedgesystems.com/aiq/traderstips/traders-tips-january-2011.htm


