Jul 13, 2016 | educational newsletters, fundamental analysis
Dividends for U.S. companies continue to be under pressure as fewer issues are increasing payments and those issues that do increase do so at a lower rate. Within the S&P 500®, the average dividend increase for Q2 2016 was +10.56%, down from +10.62% in Q1 2016 and +13.08% for all of 2015. The pace of dividend cuts continues to rise, as Q2 saw a substantial increase in cuts from mid and small-cap energy issues, with the overall aggregate dollar 12-month cuts rising 157% over the prior 12-month period. Yet, the over-all dividend increases continue to outweigh the decreases. So the outlook remains positive.
Energy and Materials issues are expected to remain under pressure for 2016, potentially resulting in disappointing announcements for earnings, capital investments, buybacks and dividends. Assuming dividend policies remain unchanged, the U.S. equity market in 2016 is positioned to set another record in payments, especially in the S&P 500®, but the increase is seen as being in the mid-single digit range, not the double-digits seen over the past few years.
The good news for dividends is that, while things are difficult, the majority of issues continue to increase and have the resources to do so for the near future.
Large, Mid, Small Caps
Within the S&P 500®, 418 issues, or 82.8% currently pay a dividend. All 30 members of the Dow Jones Industrial Average® pay a dividend as well.
Within the S&P Mid Cap 400®, 69.3% of the issues within pay a cash dividend, a decrease from 70.3% in Q1 2016. Within the S&P Small Cap 600®, 51.4% of the issues pay a dividend, which is unchanged from Q1 2016.
Yields continued to vary among the various market indices.
Large-Caps at 2.17% (no change from the 2.17% in Q1 2016).
Mid-Caps at 1.68% (1.69% in Q1 2016).
Small-Caps at 1.38% (1.47% in Q1 2016).
The yields across dividend paying market-size classifications continue to be compatible, with large-caps coming in at 2.54% (the same as Q1 2016), mid-caps at 2.37% (2.36% in Q1 2016) and small-caps at 2.47% (2.50% in Q1 2016).
Contributed by Top Stock Analyzer
Stocks which received upward revisions to current year consensus earnings estimates and show a lower uncertainty of earnings tend to outperform over time…..LEARN MORE
Jul 7, 2016 | earnings, educational newsletters, fundamental analysis, Top Stock analyzer
Have you ever bought a stock you thought had great earnings, only to see it fail miserably?
It is not enough to have a list of great fundamental stocks. You must go deeper into the analysis of each final candidate on the list. But, what other analysis can be done? At Top Stock Analyzer we use our own proprietary tool, we call the the FATI® Score to help us unlock profits.
The FATI® Score is based upon leading investment research studies which show stocks with a lower standard deviation of earnings estimates from the consensus (higher degree of agreement among analysts) the better performance of the stock.
The study concluded stocks with a higher degree of earnings certainty (lower standard deviation of estimates) outperformed stocks with a lower degree of earnings certainty by +8.7% per year over a fifteen-year period. That is a significant performance enhancement. One which cannot be ignored.
With out FATI® Score we fine tune stock selection beyond a list of great fundamentally screened stocks. There is no magic here, nor any guarantees, but face it; investing is hard enough. Why not select stocks which have a high probability of outperforming the markets both long and short?
Each week we generate a report of high scoring stocks both long and short, then feature one stock for an in-depth analysis.
Here’s an excerpt from our May 30, 2016 newsletter and the long stock that the FATI® Score highlighted
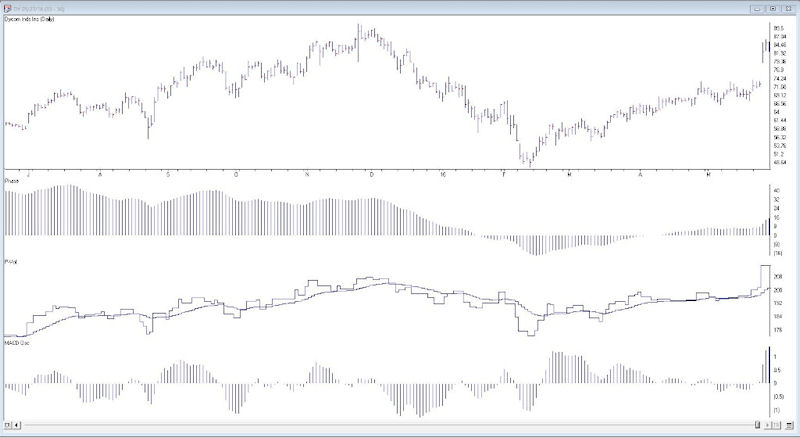
Featured Stock – Dycom Industries – DY
Industry – Heavy Construction
Dycom Indiustries is a specialty contracting firm servicing
the telecom and utilities industries. The firm provides engineering, construction and maintenance services. They
have a long list of prominent clients, such as AT&T, Verizon, Comcast and Century Link.
Dycom is experiencing enormous
growth due to the high demand for network and mobile bandwidth. As the bandwidth demand grows, customers need to
expand the capacity of their networks. This demand has created a backlog of over $5.6 billion is contract work
for Dycom. With this years sales growth estimated at over 26% earnings should continue to be outstanding.
As of 7/6/2016 DY was up 6.59%
Here’s an excerpt from our June 6, 2016 newsletter and the long stock that the FATI® Score highlighted
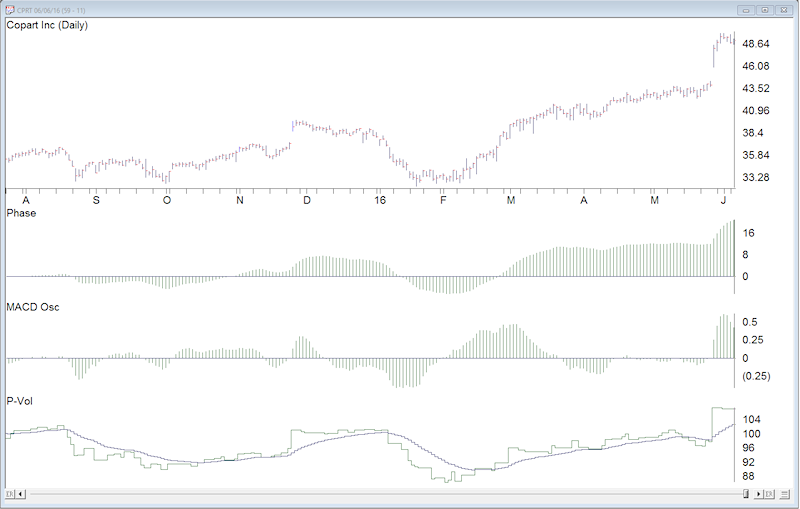
Featured Stock – Copart, Inc. – CPRT
Industry – Auction/Valuation Services
Copart, Inc. provides online auction and related services to
process or sell salvage and marketable vehicles. The buyers and sellers include
insurance companies, banks and financial institutions, car dealerships, fleet
operators, and vehicle rental companies, licensed dealers and of course the
general public as well.
The company’s operations span the globe. Operations are well
established in Canada, Europe, South America and India. With increasing
revenues. declining expenses and global expansion into the Middle East, Copart
has been hitting on all cylinders. So far in 2016 the company has added 4 new
facilities to handle the increase in volume. Two in Colorado and two in Texas.
Earnings revisions are strong and are coming in higher
across quarterly and annual estimates. With a three year projected EPS growth
rate of 27% the party is not over yet. The P/E of 23 may sound expensive on a
relative basis, but with its EPS growth rate, it is actually reasonable.
As of 7/6/2016 CPRT was up 1.15%
The ‘Short Side’ List
We also analyze for candidates to consider shorting for downward trending markets. The criterion for screening is not exactly the opposite of the long screen. To be most effective with the short list and minimize your risk associated with shorting, it is best to look for newcomers to the short list on a weekly basis.
Remember, shorting is an advanced trading technique. You have unlimited loss potential, so remember to be selective, use a stop loss order and only short in a confirmed downward trending market.
Here’s an excerpt from our June 13, 2016 newsletter and the short stock that the FATI® Score highlighted
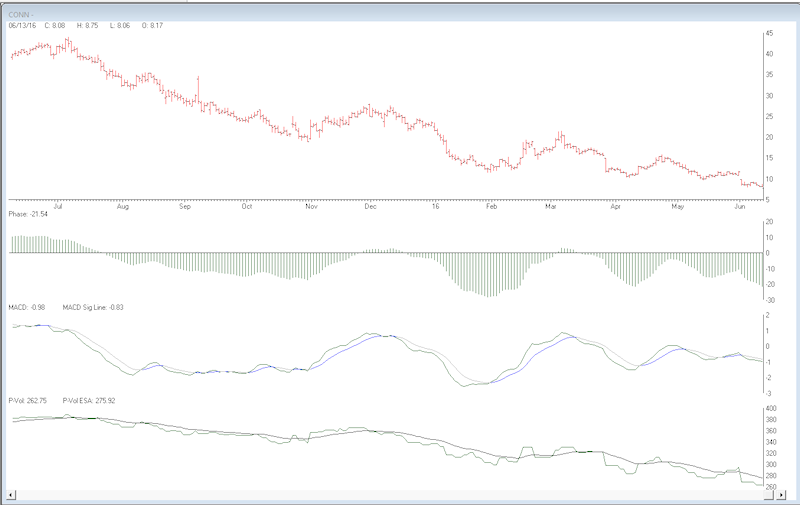
Featured Stock – Conn, Inc. – CONN
Industry – Specialty Retailer
Conn, Inc is a regional specialty retailer in the southern
part of the U.S., in particular Texas and Louisiana. They sell home appliance
and garden equipment along with an array of other electronics. The company has
seen their gross margin severely impact by the rising cost of goods. In
addition their interest expense has doubled over the past year. These items, as
well as others have cause a severe contraction in earnings.
There doesn’t seem to be any daylight coming for Conn.
Earnings are expected to decline -89% this year, the P/E stands at 73 and F1
estimates have fallen from $1.77 to $0.11 over the past 90 days. Of the six
analysts following the stock, there doesn’t appear to be any agreement on the
actual EPS as depicted in a FATI Score of 534. Remember, anything over a score
of 12 or higher is disqualified from our long recommendations list.
With a pending market decline and the growing deterioration
of Conn, Inc. fundamentals, we see this as a good shorting opportunity. As with
any short trade, place a stop order and monitor the stock daily.
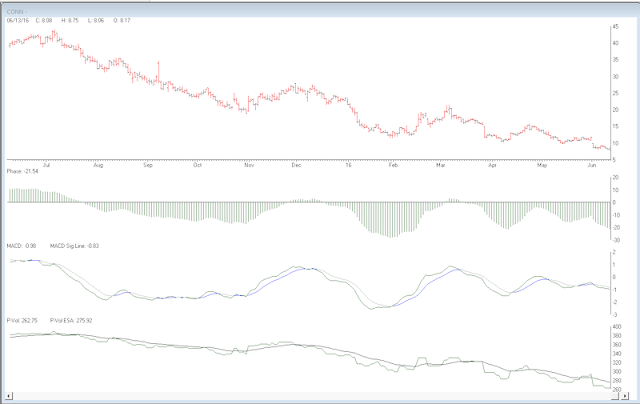
As of 7/6/2016 CONN was up 12.73%
Putting it All Together
There you have it. “Fundamentals Made Simple”. Just select your stocks from the list and go right into your technical analysis. All the fundamental screening has already been done for you. Each and every week you will receive an updated screening of Top Stock Analyzer with the power of the FATI® Score. You can see the score of each stock.
Here’s our featured stock performance as of 7/6/2016
Our weekly newsletter is a collaboration between AIQ Systems LLC and Fortunatus Advisors, Inc. if you want to learn more about our service visit