Mar 29, 2016 | EDS code, Expert Design Studio, indicators
Here is some code for use in AIQ based on Markos Katsanos’s article in this issue, “Trading The Loonie.” The code and EDS file can be downloaded from www.TradersEdgeSystems.com/traderstips.htm.
The code I am providing contains both the divergence indicator and a long-only trading system for the NASDAQ 100 list of stocks. Along with fx trading online, I wanted to try the divergence idea and the author’s entry rules on the NASDAQ 100 stocks. The stocks are traded long using the author’s entry rules with two of the parameters adjusted as shown at the top of the code file. The exit has been changed completely to use a profit protect (protect 50% of profits once a 20% profit is reached), a stop-loss (protect 75% of capital), and a time-stop exit (exit after 21 days). I used the NASDAQ 100 index (NDX) in place of the crude oil futures. The assumption is that since the stocks on the list are all in the NDX, they would generally be correlated to the index. The author’s entry rule filters out those with a negative correlation to the index. Note that I changed the minimum correlation from a -0.4 to 0.0. In addition, I found that increasing the minimum divergence from 20 to 2,000 increased the Sharpe ratio and decreased the maximum drawdown without affecting the annualized return.
Figure 6 shows the equity curve versus the NASDAQ 100 index for the period 1/5/2000 to 10/14/2015. Figure 7 shows the metrics for this same test period. The system clearly outperformed the index.

FIGURE 6: AIQ. Here is a sample equity curve for the modified divergence system versus the NASDAQ 100 index for the period 1/5/2000 to 10/14/2015.

FIGURE 7: AIQ. Here are the metrics for the modified system and the test settings.
!TRADING THE LOONIE
!Author: Markos Katsanos, TASC December 2015
!coded by: Richard Denning 10/17/15
!www.TradersEdgeSystems.com

!Set parameters:
 Define Len        20. !Default is 20
 Define F1          2. !Default is 2
 Define F2          4. !Default is 4
 IDX is         "NDX". !NASDAQ 100 index
 IDXsLen is        40. !Default is 40
 minDIVERG is    2000. !Default is 20
 minROC is          0. !Default is 0
 minCorrel is     0.0. !Default is -0.4

!Close percent relative to BB band width for stock:
Variance is Variance([close],Len).
StdDev is Sqrt(Variance).
SMA is simpleavg([close],Len).
stkBB is 1+([close]-SMA+F1*StdDev)/(F2*StdDev).

!Close percent relative to BB band width for index:
IDXc is tickerUDF(IDX,[close]).
VarianceIdx is Variance(IDXc,Len).
StdDevIDX is Sqrt(Variance).
SMAidx is simpleavg(IDXc,Len).
idxBB is 1+(IDXc-SMAidx+F1*StdDevIDX)/(F2*StdDevIDX).

DIVERG is (idxBB-stkBB)/stkBB*100.     !PLOT AS CUSTOM INDICATOR
DIVERG1	is valresult(DIVERG,1).
ROC2 is ([close]/val([close],2)-1)*100.
ROC3 is ([close]/val([close],3)-1)*100.
ROC3idx is tickerUDF(IDX,ROC3).
IDXsma is simpleavg(IDXc,IDXsLen).
IDXsma2 is valresult(IDXsma,2).
HHVdiverg is highresult(DIVERG,3).

Setup1 if highresult(DIVERG,3) > minDIVERG.
Setup2 if DIVERG < valresult(DIVERG,1).
Setup3 if ([close]/val([close],2)-1)*100 > minROC.
Setup4 if IDXsma > valresult(IDXsma,2).
Setup5 if pCorrel > minCorrel.

Buy if 	Setup1 and
	Setup2 and
	Setup3 and
	Setup4 and
	Setup5.

BuyAlt if Buy.

LongExit1 if MACD<sigMACD and valrule(MACD>sigMACD,1) and
	     Stoch > 85.
LongExit2 if lowresult(DIVERG,3)<-20 and ROC3idx<-0.4.
LongExit3 if [close]<loval([close],15,1) and pCorrel<minCorrel.
LongExit if LongExit1 or LongExit2 or LongExit3.

AlterLongExit if {position days} >=21 or [close] <= (1-0.25)*{position entry price}.

!Code to Calculate Pearson's R [for entry]:
! PeriodtoTest is the number of lookback days.
! IndexTkr is the Instrument that you which to compare your list to.
PeriodToTest is Len.
IndexTkr is IDX.
ChgTkr is ([open] / val([open],PeriodToTest)-1)*100.
ChgIdx is TickerUDF(IndexTkr,ChgTkr).
Alpha is ChgTkr - ChgIdx.

ValUDF is (([close]-[open])/[open]) * 100.
ValIndex is TickerUDF(IndexTkr, ValUDF).
ValTkr is ValUDF.
SumXSquared is Sum(Power(ValIndex,2), PeriodToTest).
SumX is Sum(ValIndex, PeriodToTest).
SumYSquared is Sum(Power(ValTkr,2), PeriodToTest).
SumY is Sum(ValTkr, PeriodToTest).
SumXY is Sum(ValTkr*ValIndex, PeriodToTest).
SP is SumXY - ( (SumX * SumY) / PeriodToTest ).
SSx is SumXSquared - ( (SumX * SumX) / PeriodToTest ).
SSy is SumYSquared - ( (SumY * SumY) / PeriodToTest ).

!Pearson's R and Pearson's Coefficient of Determination:
pCorrel is SP/SQRT(SSX*SSY).

!Code to Calculate Pearson's R [for exit]:
! PeriodtoTest is the number of lookback days.
! IndexTkr is the Instrument that you which to compare your list to.
PeriodToTestX is 3*Len.
IndexTkrX is IDX.
ChgTkrX is ([open] / val([open],PeriodToTestX)-1)*100.
ChgIdxX is TickerUDF(IndexTkrX,ChgTkrX).
AlphaX is ChgTkrX - ChgIdxX.

ValUDFX is (([close]-[open])/[open]) * 100.
ValIndexX is TickerUDF(IndexTkrX, ValUDFX).
ValTkrX is ValUDFX.
SumXSquaredX is Sum(Power(ValIndexX,2), PeriodToTestX).
SumXX is Sum(ValIndexX, PeriodToTestX).
SumYSquaredX is Sum(Power(ValTkrX,2), PeriodToTestX).
SumYX is Sum(ValTkrX, PeriodToTestX).
SumXYX is Sum(ValTkrX*ValIndexX, PeriodToTestX).
SPX is SumXYX - ( (SumXX * SumYX) / PeriodToTestX).
SSxX is SumXSquaredX - ( (SumXX * SumXX) / PeriodToTestX ).
SSyX is SumYSquaredX - ( (SumYX * SumYX) / PeriodToTestX ).

!Pearson's R and Pearson's Coefficient of Determination:
pCorrelX is SPX/SQRT(SSXX*SSYX).

!MACD code:
S is 12.
L is 25.
X is 9.

ShortMACDMA is expavg([Close],S).
LongMACDMA is expavg([Close],L).

MACD is ShortMACDMA-LongMACDMA.
SigMACD is expavg(MACD,X).

!Stochastic
StochLen is 30.
Stoch is 100 * (([Close]-LoVal([Low],StochLen)) /
	(HiVal([High],StochLen) - LoVal([Low],StochLen))).

List if 1.
—Richard Denning
info@TradersEdgeSystems.com
Mar 29, 2016 | EDS code, trading strategies
The TradingExpert code based on Ken Calhoun’s article in the March 2016 issue of Stocks and Commodities, “ADX Breakouts,” is provided at below.
Since I mainly work with daily bar strategies, I wanted to test the ADX concept from the article on a daily bar trading system. So I set up a system that buys after a stock has based around the 200-day simple moving average (Basing200). Basing200 is coded in the system as:
- The stock closing above the 200-SMA only 19 bars or less out of the last 100 bars, and
- The stock closing greater than two bars above the 200-SMA in the last 10 bars.
For exits, I used the following built-in exits: a capital-protect exit set at 80% and a profit-protect exit set at 80% once profit reaches 5% or more.
I ran this system on the NASDAQ 100 list of stocks in the EDS backtester over the period 12/31/1999 to 1/11/2016. I then ran a second test on the system using the ADX filter (ADX must be greater than 40 at the time of the signal to buy). I used the same list of stocks, exits, and test period.
Figure 8 shows the first test without the filter: 883 trades, 1.84% average profit per trade, 1.51 reward/risk. Figure 9 shows the second test with the filter: 151 trades, 2.12% average profit per trade, 1.66 reward/risk.

FIGURE 8: WITHOUT FILTER. Here are the EDS test results for the example system without the ADX filter.

FIGURE 9: AIQ, WITH FILTER. Here are the EDS test results for the example system with the ADX filter.
Although all of the key metrics are better with the filter, there is a significant reduction in the number of trades. In fact, 151 trades would not be sufficient for a trading system over this long test period. If one wanted to use the filter, then the list of stocks would need to be increased to about 2,000 stocks.
!ADX BREAKOUTS
!Author: Ken Calhoun, TASC March 2016
!Coded by: Richard Denning, 1/11/2016
!www.TradersEdgeSystems.com

!NOTE; THIS SAMPLE SYSTEM IS FOR
           !DAILY BAR TESTING OF ADX FILTER ONLY

SMA200 is simpleavg([close],200).
HD is hasdatafor(250).
Above200 if ( [close] > SMA200 ) .
Basing200 if CountOf(Above200,10) >2
 and CountOf(Above200,100) <20 .="" and="" basing200="" buy="" hd="" if="">200.
ADXhi if [ADX] >= 40.
BuyADX if Buy and ADXhi.
Sep 25, 2015 | color studies, EDS code
The WinWay EDS code based on Vitali Apirine’s June 2015 article in S&C, “The Slow Volume Strength Index,” is provided for download from the following website:
www.TradersEdgeSystems.com/traderstips.htm
!THE SLOW VOLUME STRENGTH INDEX
!Author: Vitali Aiprine, TASC April 2015
!Coded by: Richard Denning 6/10/2015
!www.TradersEdgeSystems.com
!INPUTS FOR INDICATOR:
emaLen is 6.
wilderLen is 14.
!INDICATOR FORMULAS:
ema is expavg([close],emaLen).
pDif is iff([close] – ema > 0,[volume],0).
nDif is iff([close] – ema < 0,[volume],0).
rsiLen is 2 * wilderLen – 1.
AvgU is expavg(pDif,rsiLen).
AvgD is expavg(nDif,rsiLen).
svsi is 100-(100/(1+(AvgU/AvgD))). !PLOT
The code provided for the slow volume strength index (SVSI) may be plotted as an indicator, as shown in Figure 6.
Sample Chart
FIGURE 6: WinWay TradingExpert Pro Charts. Here is the SVSI (6,14) indicator compared to the classic RSI (14).

—Richard Denning
info@TradersEdgeSystems.com
for AIQ Systems
Jul 24, 2014 | EDS code, indicators, trading strategies
Original article by Mike B. Siroky
For this June’s Stocks & Commodities Tips, I substituted the article by Mike B. Siroky, “Wilder’s RSI: Extending the Time Horizon” for the article by Sylvain Vervoort.
I provide a system that uses the author’s adjustable RSI bands that automatically adjust to the appropriate level for the input RSI length. The system is very simple:
- Buy next bar at market open when the RSI is less than the lower confidence interval band (RSI_CILOW).
- Exit the long position next bar at market open when the RSI is greater than the upper confidence interval band (RSI_CIUP).
- Reverse rules for shorting.
- I have a parameter that allows testing long only, short only or both long and short.
- The system lost when the short side was allowed to trade.
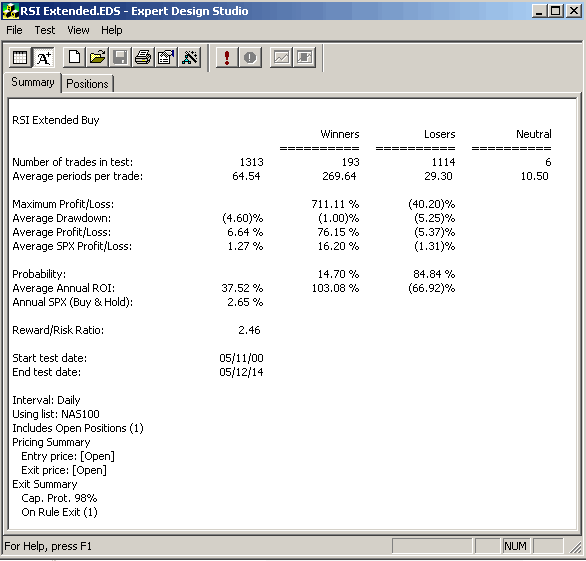
Figure 1 shows the AIQ EDS Summary long only back-test report using the NASDAQ 100 list of stocks over the period 5/11/2000 to 5/12/2014. Neither commission nor slippage have been subtracted from these results. In running this test, I used a capital protect of 98% which is equivalent to a 2% stop loss using the close. All entries and exits are at the next open. I could not get the short side to show a profit even with added market timing filters for trend on the NASDAQ 100 index.
AIQ EDS Summary long only back-test report using the NASDAQ 100 list of stocks over the period 5/11/2000 to 5/12/2014.
!WILDER’S RSI: EXTENDING THE TIME HORIZON
!Author: Mike B. Siroky, TASC May 2014
!Coded by: Richard Denning 5/10/2014
!www.TradersEdgeSystems.com
!INPUTS:
W1 is 55. !RSI length for going long
W2 is 5. !RSI length for going short
numSD is 1.645.
!CONSTANT:
EXPECTED_VALUE is 50.
!USER DEFINED FUNCTIONS
!RSI BANDS:
RSI_CIUP1 is (EXPECTED_VALUE/100 + Sqrt(EXPECTED_VALUE/100/2/W1)*numSD)*100.
RSI_CILOW1 is (EXPECTED_VALUE/100 – Sqrt(EXPECTED_VALUE/100/2/W1)*numSD)*100.
RSI_CIUP2 is (EXPECTED_VALUE/100 + Sqrt(EXPECTED_VALUE/100/2/W2)*numSD)*100.
RSI_CILOW2 is (EXPECTED_VALUE/100 – Sqrt(EXPECTED_VALUE/100/2/W2)*numSD)*100.
!RSI WILDER:
U is [close]-val([close],1).
D is val([close],1)-[close].
rsiLen1 is 2 * W1 – 1.
AvgU is ExpAvg(iff(U>0,U,0),rsiLen1).
AvgD is ExpAvg(iff(D>=0,D,0),rsiLen1).
RSI_1 is 100-(100/(1+(AvgU/AvgD))).
rsiLen2 is 2 * W2 – 1.
AvgU2 is ExpAvg(iff(U>0,U,0),rsiLen2).
AvgD2 is ExpAvg(iff(D>=0,D,0),rsiLen2).
RSI_2 is 100-(100/(1+(AvgU2/AvgD2))).
!RULES:
HD if hasdatafor(210) >= 200.
Buy if RSI_1 < RSI_CILOW1 and HD.
Exit if RSI_1 > RSI_CIUP1 and HD.
NDXc is TickerUDF(“NDX”,[close]).
Sell if RSI_2 > RSI_CIUP2 and NDXc < simpleavg(NDXc,200) and HD.
Cover if RSI_2 < RSI_CILOW2 and HD.
Jul 11, 2014 | EDS code, trading strategies
The AIQ code based on Perry Kaufman’s article in the June 2014 Stocks & Commodities magazine, “Slope Divergence: Capitalizing On Uncertainty,” is provided at
www.TradersEdgeSystems.com/traderstips.htm.
I have modified the implementation somewhat from the author’s descriptions. I did not find that the system was exiting in an average of six days but was holding for a longer period. My exits might be the issue so I added a time exit that can be used to force an exit after the “maxBars” input number of bars. I liked the results when my time exit was set to hold for a maximum of nine bars.
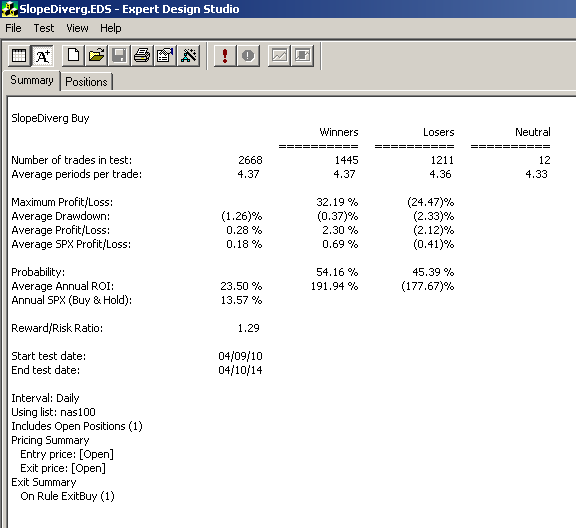
Figure 7 shows the AIQ EDS summary long-only backtest report using the NASDAQ 100 list of stocks over the prior four years ending 4/10/2014. Neither commission nor slippage have been subtracted from these results. To get the short side of the system to show a profit, I added slope filters on the NASDAQ 100 index. Note that my parameter settings differ from those suggested by the author.
FIGURE 7: AIQ, SAMPLE RESULTS. Here is a sample AIQ EDS summary long-only backtest report using the NASDAQ 100 list of stocks over the prior four years ending 4/10/2014.
The code and EDS file can be downloaded from www.TradersEdgeSystems.com/traderstips.htm. The code is also shown here:
!SLOPE DIVERGENCE: CAPITALIZING ON UNCERTAINTY
!Author: Perry Kaufman, TASC June 2014
!Coded by: Richard Denning 4/7/2014
!www.TradersEdgeSystems.com
!INPUTS:
momLen is 10.
dvgLen1 is 5.
dvgLen2 is 7.
dvgLen3 is 10.
entryNum is 3.
maxDiverg is 3.
minPrice is 10.
maxBars is 3.
!USER DEFINED FORMULAS:
C is [close].
L is [low].
H is [high].
HH is highresult(H,momLen).
LL is lowresult(L,momLen).
stoch is (C - LL) / (HH - LL).
momSlope1 is slope2(stoch,dvgLen1).
momSlope2 is slope2(stoch,dvgLen2).
momSlope3 is slope2(stoch,dvgLen3).
priceSlope1 is slope2(C,dvgLen1).
priceSlope2 is slope2(C,dvgLen2).
priceSlope3 is slope2(C,dvgLen3).
dvgBuy1 if priceSlope1 > 0 and momslope1 < 0.
dvgBuy2 if priceSlope1 > 0 and momslope2 < 0.
dvgBuy3 if priceSlope1 > 0 and momslope3 < 0.
dvgSell1 if priceSlope1 < 0 and momslope1 > 0.
dvgSell2 if priceSlope1 < 0 and momslope2 > 0.
dvgSell3 if priceSlope1 < 0 and momslope3 > 0.
nPriceSUp is priceSlope1 > 0 + priceSlope2 > 0 + priceSlope3 > 0.
nMomSUp is momSlope1 > 0 + momSlope2 > 0 + momSlope3 > 0.
nPriceSDown is priceSlope1 < 0 + priceSlope2 < 0 + priceSlope3 < 0.
nMomSDown is momSlope1 < 0 + momSlope2 < 0 + momSlope3 < 0.
dvgBuySum is dvgBuy1 + dvgBuy2 + dvgBuy3.
dvgSellSum is dvgSell1 + dvgSell2 +dvgSell3.
Buy if dvgBuySum >= entryNum and C > minPrice.
AllComboExit if (nPriceSDown = maxDiverg and nMomSDown = maxDiverg)
or (nPriceSUp = maxDiverg and nMomSUp = maxDiverg).
Time if {position days} >= maxBars.
ExitBuy if AllComboExit or Sell or Time.
Sell if dvgSellSum >= entryNum.
ExitSell if AllComboExit or Buy or Time.
May 30, 2014 | color studies, EDS code, Stocks & Commodities Traders Tips, trading strategies
The AIQ code and EDS file based on Donald W. Pendergast’s article in the 2014 Bonus Issue of
Stocks & Commodities, “A Trading Method For The Long Haul,” can be found at http://
TradersEdgeSystems.com/traderstips.htm.
The code I provide there for the long haul system is modified somewhat from the author’s descriptions as follows. First, I did not implement the fundamental rule, but this can be done if a data source is located that can export the fundamental fields needed for each stock into a .csv file. This could then be imported into the fundamental module. Second, I modified the exit to add an RSI profit target and changed some of the exit parameters.
To get the code to run properly, the AIQALL list of stocks and groups must be installed and updated on the user’s computer. To do this, first get the most recent AIQALL list from the AIQ website, then add all the stocks from the latest data disk that have trading volume greater than about 200,000 shares. We need these in order to have enough stocks to compute the group indexes. Next, we would download data for all the stocks in the database up to the current date. Then, as shown in Figure 6, we would set the RS tickers to the AIQALL list, and also, as shown in Figure 7, recompute all dates for all the groups in the AIQALL list.
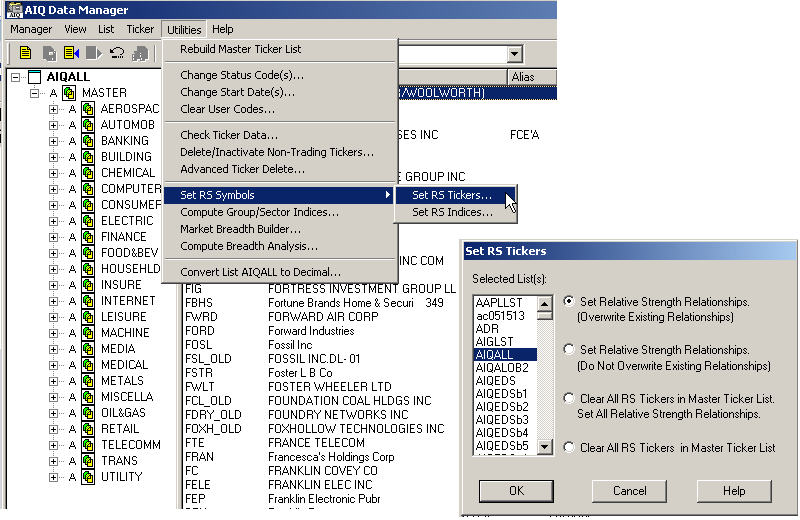
FIGURE 6: AIQ DATA MANAGER. Use the AIQ Data Manager to set the RS tickers to the AIQALL list.
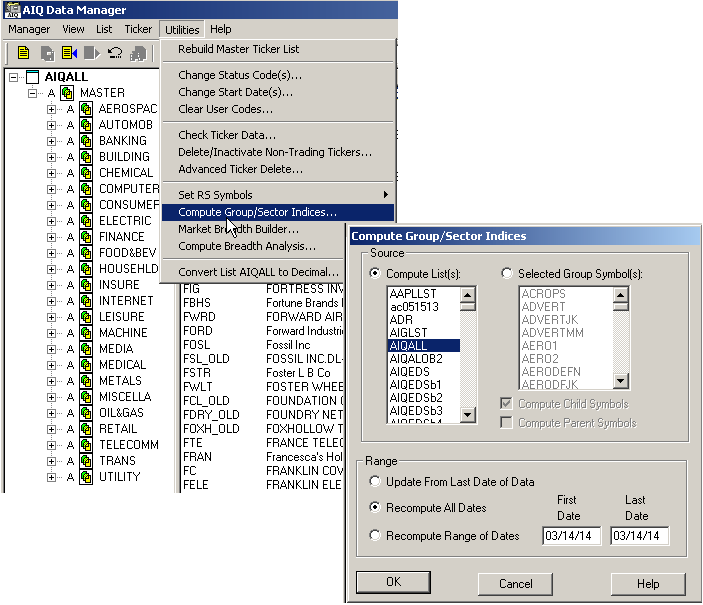
FIGURE 7: AIQ DATA MANAGER. Use the AIQ Data Manager to compute the group & sector indexes for the AIQALL list.
The EDS file containing the code has the properties set to the AIQALL list. If you are building an EDS file directly from the code listing below, then be sure to set the properties to the AIQALL list.
!A Trading Method for the Long Haul
!Author: Donald W. Pendergast Jr., TASC Bonus Issue 2014
!Coded by: Richard Denning 3/10/14
!www.TradersEdgeSystems.com
!INPUTS:
trendLen is 200.
rsiLen is 2.
minAvgVolume is 10000.
volaLen is 21.
relStrLen is 80.
minVolaRatio is 0.5.
rsSPXmin is 1.0.
rsGroupmin is 1.0.
trailBars is 2.
rsiBuyLvl is 5.
rsiExitLvl is 95.
exitLen is 18.
C is [close].
H is [high].
L is [low].
PD is {position days}.
!LONG TERM MOVING AVERAGE:
emaLT is expavg(C,trendLen).
emaST is expavg(L,exitLen).
!RSI WILDER
!To convert Wilder Averaging to Exponential Averaging use this formula:
!ExponentialPeriods = 2 * WilderPeriod - 1.
U is C-valresult(C,1).
D is valresult(C,1)-C.
rsiLen1 is 2 * rsiLen - 1.
AvgU is ExpAvg(iff(U>0,U,0),rsiLen1).
AvgD is ExpAvg(iff(D>=0,D,0),rsiLen1).
rsi is 100-(100/(1+(AvgU/AvgD))).
!VOLATILITY
price1 is H.
price2 is L.
ratio is price1 / price2.
dp is Ln(ratio).
dpsqr is Ln(ratio) * Ln(ratio).
totdpsqr is sum(dpsqr,volaLen).
sumdp is sum(dp,volaLen).
sumdpsqr is sumdp * sumdp.
sumdpave is sumdpsqr / volaLen.
diff is totdpsqr - sumdpave.
!!use 252 for daily, or 52 for weekly below
factor is 252 / (volaLen-1).
result is sqrt(diff * factor).
vola  is result * 100 .
volaAvg is expavg(vola,volaLen).
volaSPXavg is tickerUDF("SPX",volaAvg).
volaRatio is volaSPXavg/volaAvg.
!AVERAGE VOLUME
avgVolume is expavg([volume],50).
!RELATIVE STRENGTH
roc is C / valresult(C,relStrLen).
rocSPX is tickerUDF("SPX",roc).
rocGroup is tickerUDF(rsticker(),roc).
groupSymbol is tickerUDF(rsticker(),symbol()).
groupName is tickerUDF(rsticker(),description()).
rsSPX is roc / rocSPX.
rsGroup is rocGroup / rocSPX.
!SCREENING RULES
VolumeRule if avgVolume > minAvgVolume.
TrendRule if C > emaLT.
VolaRule if volaRatio > minVolaRatio and simpleavg(H-L,10) > simpleavg(H-L,200).
RelStrRule if rsSPX > rsSPXmin and rsGroup > rsGroupmin.
PullbackRule if rsi < rsiBuyLvl.
EnoughData if hasdatafor(trendLen+10) > trendLen.
!FundamentalRule if [eps]>[eps est].
Screen if EnoughData
and TrendRule
and VolaRule
and RelStrRule
and PullbackRule
!and FundamentalRule
and VolumeRule.
EntryTrigger if C > lowresult(H,2,1).
Buy if valrule(Screen,1) and EntryTrigger.
Exit if (C < lowresult(L,trailBars,1))
or
(valrule(C > emaST,1) and C < emaST)
or
rsi > rsiExitLvl.
ShowValues if EnoughData.


