Jul 5, 2017 | bonds, educational newsletters, ETFs, indexes, jay kaeppel, market timing
In the end it is not so much about “predicting” what will happen next in the financial markets, but rather recognizing – and being prepared for – the potential risks, that makes the most difference in the long run. So let’s start by looking at current trends.
Stocks
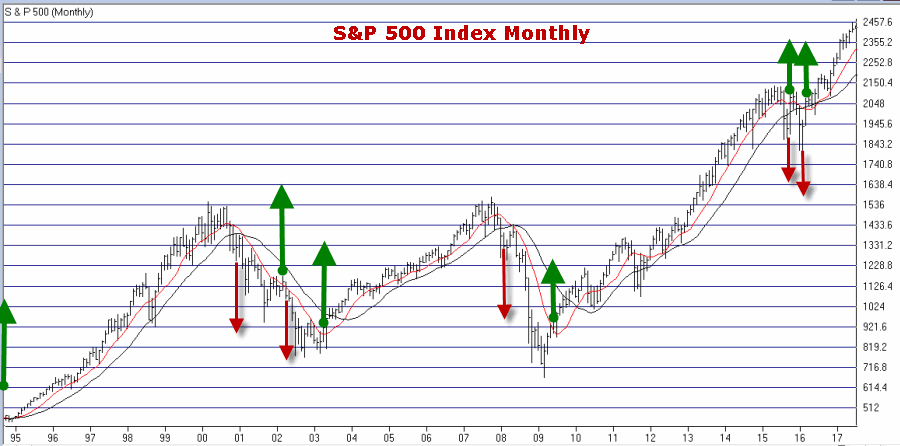
Let’s start with a most simple trend-following model that works like this:
-A sell signal occurs when the S&P 500 Index (SPX) registers two consecutive monthly closes below its 21-month moving average
-After a sell signal, a buy signal occurs when SPX register a single monthly close above its 10-month moving average.
Figure 1 displays recent activity.
Figure 1 – SPX Trend-Following signals (Courtesy
WinWayCharts)
The good news is that this model does a good job of being out of stocks during long bear markets (1973-74, 2000-2002, 2008-2009). The bad news is that – like any trend-following model – it gets “whipsawed” from time to time. In fact the two most recent signals resulted in missing out on the October 2015 and March 2016 rallies.
But note the use of the phrase “simple trend-following model” and the lack of phrases such as “precision market timing” and “you can’t lose trading the stock market”, etc.
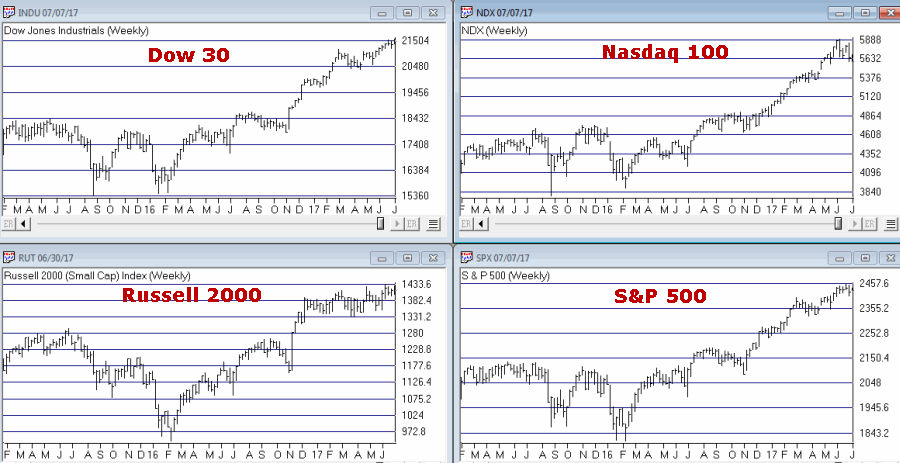
For now the trend is up. A few things to keep an eye on appear in Figures 2 and 3. Figure 2 displays four major averages. Keep an eye to see if these averages break out to the upside (see here) or if they move sideways to lower.
Figure 2 – Four Major Market Averages (Courtesy
WinWayCharts)
In addition, I suggest following
the 4 tickers in Figure 3 for potential “early warnings” – i.e., if the major averages hit new highs that are not confirmed by the majority of the tickers in Figure 3
.
Figure 3 – Four potential “Early Warning” tickers (Courtesy
WinWayCharts)
Bonds
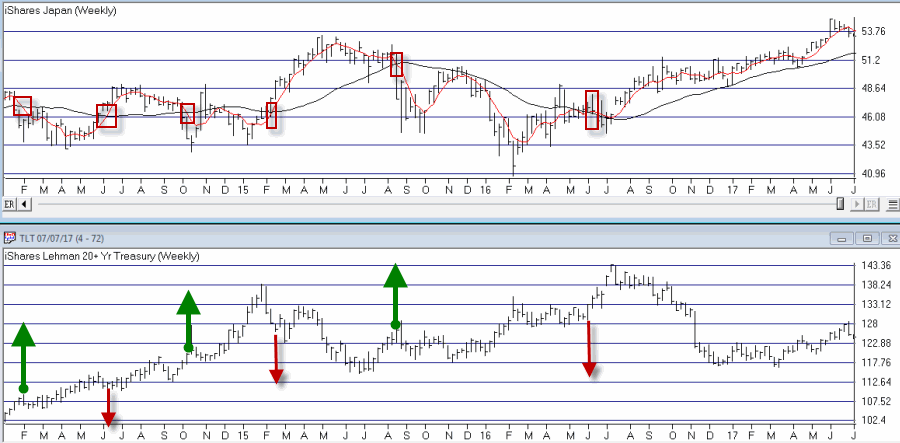
My main “simple bond trend-following model” remains bearish. As you can see in Figure 4, a buy signal for bonds occurs when the 5-week moving average for ticker EWJ (Japanese stocks) drops below its 30-week moving average and vice versa.
Figure 4 – Ticker EWJ 5-week and 30-week moving average versus ticker TLT (Courtesy
WinWayCharts)
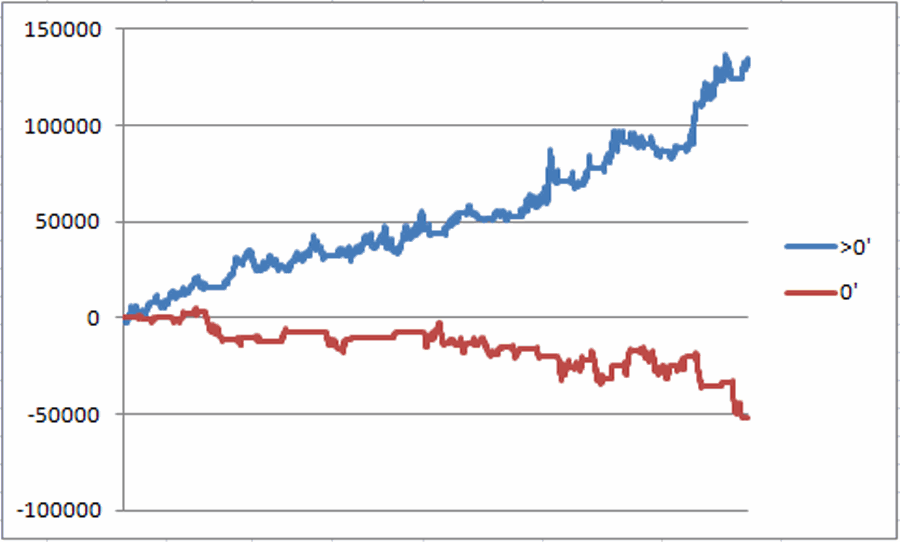
A 2nd model using metals to trade bonds has been bullish of late but is close to dropping back into bearish territory. Figure 5 displays the P/L from holding a long position of 1 t-bond futures contract ONLY when both the EWJ AND Metals models are bearish (red line) versus when EITHER model is bullish (blue line)
Figure 5 – T-bond futures $ gain/loss when EWJ OR Metals Models are Bullish (blue line) versus when EWJ AND Metals Models are both Bearish (red line); August 1990-present
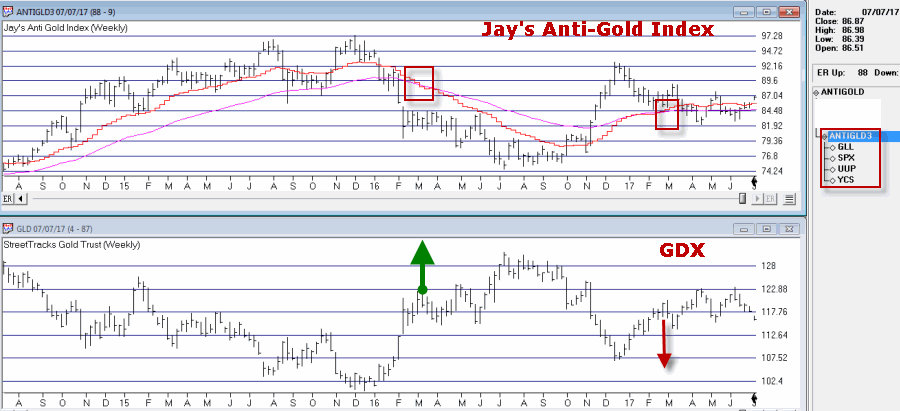
Gold
My most basic gold trend-following model is still bearish. This model uses my “Anti-Gold Index” (comprised of tickers GLL, SPX, UUP and YCS). It is bullish for gold when a Front-Weighted Moving Average (detailed here) is below the 55-week exponential moving average and vice versa.
Figure 6 – Jay’s “Anti-Gold Index” versus ticker GLD (Courtesy
WinWayCharts)
Summary
So at the moment the stock model is bullish and the bond and gold models are bearish. Are these trends certain to persist ad infinitum into the future? Definitely not. Will the models detailed here provide timely signals regarding when to get in or out the next time around? Sorry, but it doesn’t always work that way with trend-following.
But as for me I prefer “riding the trend” to “predicting the future.”
Some painful lessons just stick with you I guess.
Jay Kaeppel Chief Market Analyst at JayOnTheMarkets.com and TradingExpert Pro client.
Disclaimer: The data presented herein were obtained from various third-party sources. While I believe the data to be reliable, no representation is made as to, and no responsibility, warranty or liability is accepted for the accuracy or completeness of such information. The information, opinions and ideas expressed herein are for informational and educational purposes only and do not constitute and should not be construed as investment advice, an advertisement or offering of investment advisory services, or an offer to sell or a solicitation to buy any security.
May 8, 2017 | bonds, EDS, EDS code, educational newsletters, ETFs, jay kaeppel
There is great trepidation in the bond market these days. Most investors seem to have the “interest rates are sure to rise” mantra playing on auto loop in their head. And this is not entirely unwarranted. Given the historical tendency for bond yields to move in long, slow trends (20 years or more essentially in one direction is not uncommon), I for one am pretty confident in believing that interest rates will be higher 20 years from now than they are now.
But that is not the fear that is playing in people’s heads. The fear in people’s heads is that rates are rising soon (like immediately) and in a big way. This however, may or may not prove to be the case.
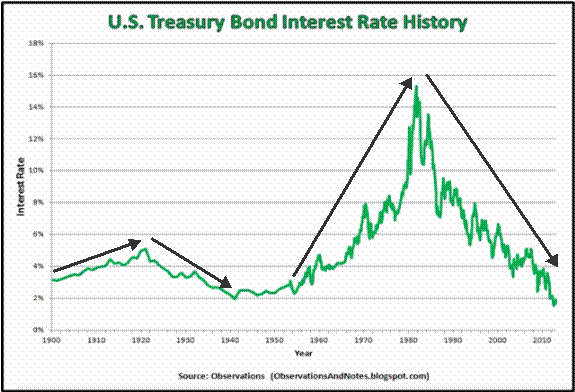
Figure 1 displays a history of 10-year treasury yields through about 2012 (FYI 10-yr. yields are roughly in changed since that time). Note the long-term nature of interest rate trends and that while there are “spikes” here and there, most major moves play out over time and not in “here today, sharply higher tomorrow” fashion.
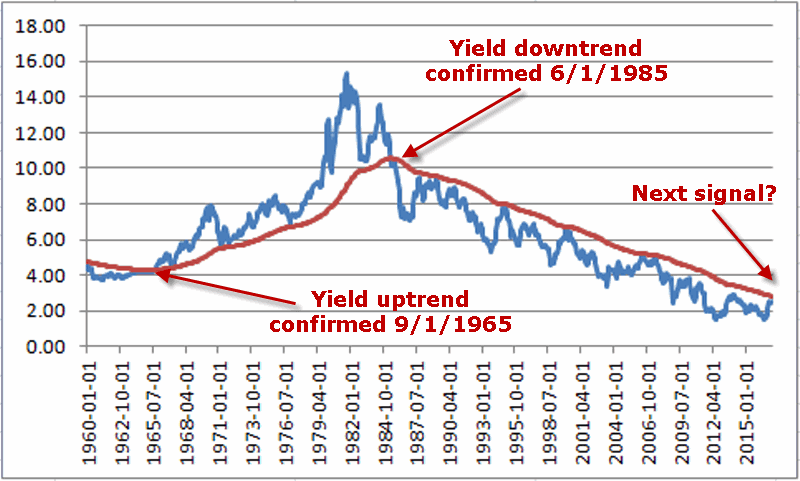
Also, you can see in Figure 2 – one can make a compelling argument that bond yields are not “officially rising”, at least not yet.
Figure 2 – Yields still “officially” in a downtrend
Bonds are Due to Bounce – But Will They?
One way to identify important turning points in any market is when a market doesn’t do something that it would normally be expected to do. For example, here is a simple thought process:
1) The bond market is oversold
2) In the past 30 years, pretty much anytime it would get oversold a rally ensued
3) Therefore, bonds should rally soon
But will they – that is the question. And in my opinion, the answer is important.
*If bonds rally soon (i.e., over the course of say the next several months) then “the status may still be quo”.
*If bonds do not rally soon, then it may be a sign that “things are changing”
Which Way Bonds?
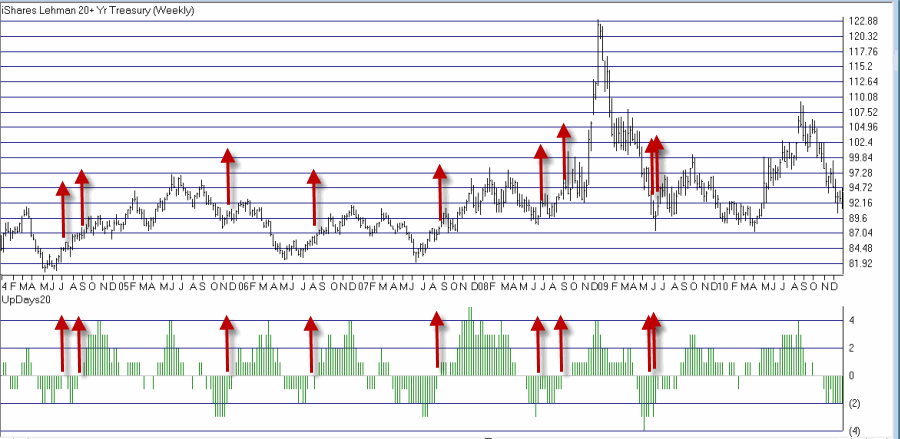
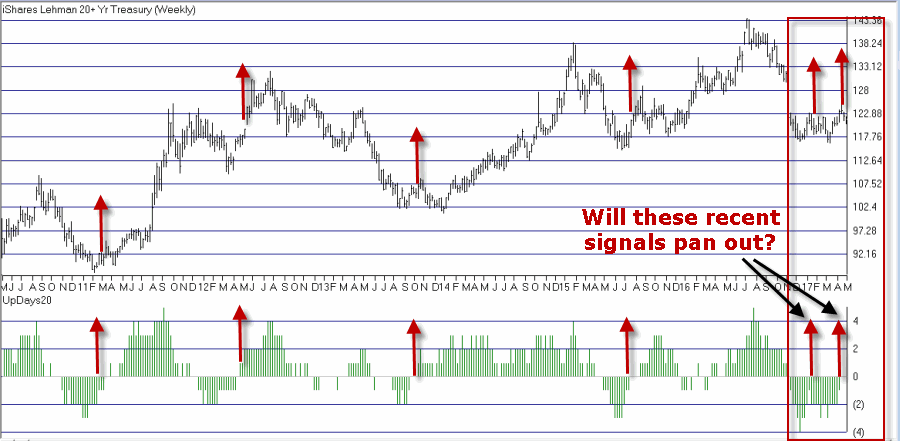
Figures 3 and 4 below display ticker TLT (an ETF that tracks the long-term treasury bond) with an indicator I call UpDays20. In this case we are looking at weekly bars and not daily bars, but the concept is the same.
UpDays20 is calculated by simply adding up all of the weeks that have showed a weekly gain over the past 20 weeks and then subtracting 10 (the WinWay Charts Expert Design Studio code appears at the end of this article, after the disclaimer).
If 10 of the past 20 weeks have showed a weekly gain then the upDays20 indicator will read 0 (i.e., a total of 10 weeks were up minus 10 = 0). If only 6 weeks showed a gain in the past 20 weeks then the UpDays20 indicator will read -4, etc.
What to look for: Typically (at least in the declining rate environment of recent decades) when UpDays20 rises by a value of 2 from a low of -2 or less, a decent rally in bonds has ensued.
For example, if UpDays20 falls to -4 then a rise to -2 or higher triggers a buy signal. If it falls only as low as -3 then a rise to -1 or higher is required. If it falls only as low as -2 then a rise to 0 or higher is required.
Figures 3 and 4 highlight signals since roughly 2004.
Figure 3 – Ticker TLT with UpDays20 weekly buy signals (2004-2010); (Courtesy
WinWay TradingExpert )
Figure 4 – Ticker TLT with UpDays20 weekly buy signals (2010-2017); (Courtesy
WinWay TradingExpert )
As you can see in Figures 3 and 4, most of the signals highlighted were followed by at least a decent short-term rally.
In 2017, buy signals from the UpDays20 indicator occurred on 1/13 and 4/14. TLT is up +0.3% since the 1/13 signal and down -1.4% since the 4/14 signal.
Summary
Either:
1) This is an excellent time to buy the long-term bond (looking for at least a short to intermediate term rally) as a rally is overdue
OR
2) The “times they may be a changing” for bonds
So keep an eye on TLT over the next several months.
Jay Kaeppel
Disclaimer: The data presented herein were obtained from various third-party sources. While I believe the data to be reliable, no representation is made as to, and no responsibility, warranty or liability is accepted for the accuracy or completeness of such information. The information, opinions and ideas expressed herein are for informational and educational purposes only and do not constitute and should not be construed as investment advice, an advertisement or offering of investment advisory services, or an offer to sell or a solicitation to buy any security.
WinWay TradingExpert Expert Design Studio Code for UpDays20
Up1 if [close] > val([close],1).
Up2 if val([close],1) > val([close],2).
Up3 if val([close],2) > val([close],3).
Up4 if val([close],3) > val([close],4).
Up5 if val([close],4) > val([close],5).
Up6 if val([close],5) > val([close],6).
Up7 if val([close],6) > val([close],7).
Up8 if val([close],7) > val([close],8).
Up9 if val([close],8) > val([close],9).
Up10 if val([close],9) > val([close],10).
Up11 if val([close],10) > val([close],11).
Up12 if val([close],11) > val([close],12).
Up13 if val([close],12) > val([close],13).
Up14 if val([close],13) > val([close],14).
Up15 if val([close],14) > val([close],15).
Up16 if val([close],15) > val([close],16).
Up17 if val([close],16) > val([close],17).
Up18 if val([close],17) > val([close],18).
Up19 if val([close],18) > val([close],19).
Up20 if val([close],19) > val([close],20).
UpCount is (Up1+ Up2+Up3+Up4+Up5+Up6+Up7+Up8+Up9+Up10+Up11+Up12+Up13+Up14+Up15+Up16+Up17+Up18+Up19+Up20)-10.
Dec 8, 2016 | bonds, educational newsletters, ETFs, jay kaeppel, trading strategy
If you have read any of my stuff in the past then you probably know that I spend a lot of time trying to determine “what goes up (or down) when”. What follows are the results of one such test.
While the results are initially impressive on the face of it (if I do so say myself, and I think I just did) there are a number of important caveats. To put it another way, do NOT be impressed with the results WITHOUT first seriously considering some of the significant caveats mentioned below. To put it in the most standard terms possible – past results DO NOT guarantee future results.
The Test
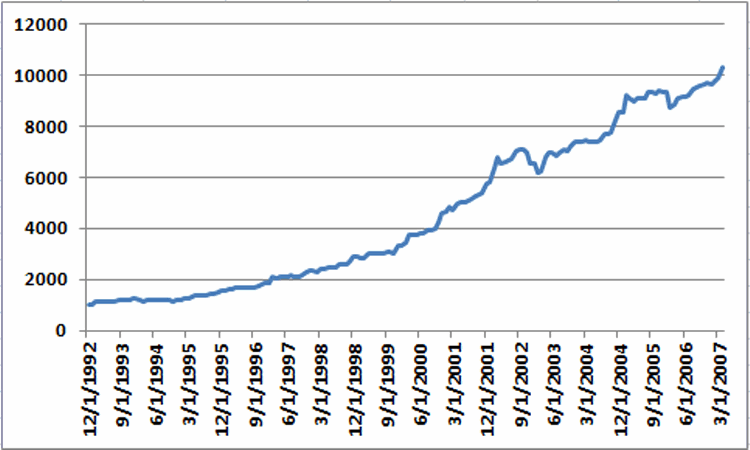
*I looked at variety of assets classes (listed at the end of the article) using mutual fund data and/or index data from January 1993 through April 2007. The data was monthly total return data from Callan Associates.
*I’ve created my own proprietary formula for measuring performance during a specific month. The factors include: average monthly return, median monthly return, standard deviation, largest monthly decline and a variety of ratios amongst these factors (but I am a lot of fun at parties. No seriously.)
*I used my proprietary formula to rank performance for each asset class for each month and took my “top pick”. In a nutshell, the “top pick” is not the one that showed the largest average monthly gain but the one that showed the best tradeoff between risk and reward.
*I ran a backtest using mutual fund and/or index data for the top ranked asset for each month from January 1993 through May 2007. The results for Jay’s One Asset Class per Month strategy (heretofore JOAC) appear in Figure 1.
Figure 1 – Equity Curve for Jay’s One Asset Class per Month Strategy; 12/31/92-5/31/2007
The average 12-month return was +17.8% and the maximum drawdown (using month-end data) was -12.7%
While the results look good it is now time for those dreaded “caveats”:
*These results could not be exactly duplicated in real trading for a couple of reasons: First, some of the results were generated using index data and not mutual fund data.
*Also, many of the mutual funds used in the test (particularly Vanguard and Fidelity funds) cannot be traded one month at a time. Most have a minimum holding period of 30 to 90 calendar days). So buying in one month and selling out the next would likely result in fees and/or future trading restrictions.
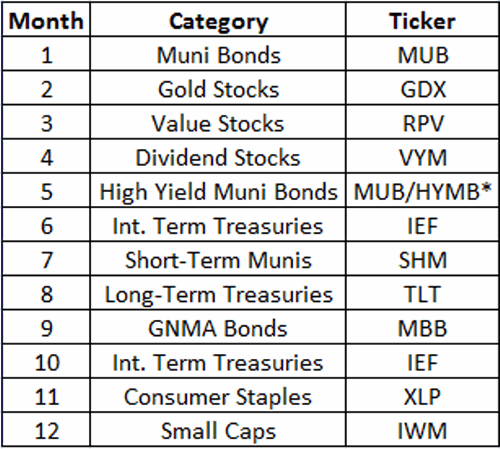
Moving Forward JOAC using ETFs
ETFs have no switching restrictions so starting in May 2007 I switched to an all ETF portfolio, using a particular ETF each month to attempt to track the top asset class for that month. That portfolio appears in Figure 2.
Figure 2 – JOAC monthly ETF Portfolio
*-MUB traded in May 2007-2010; HYMB traded in May starting in 2011
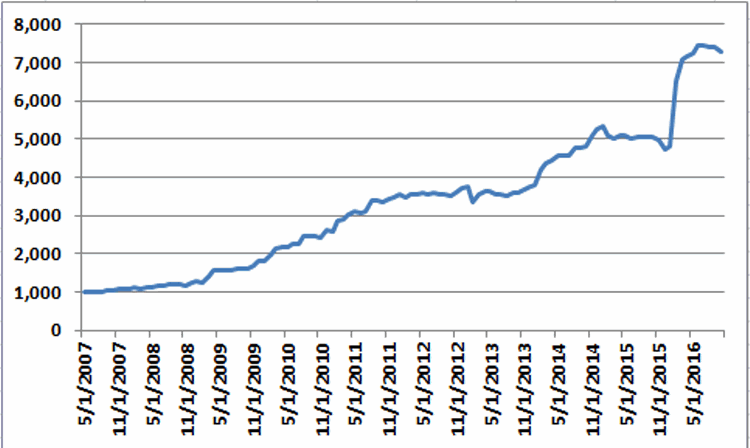
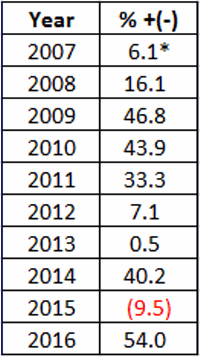
Once again using monthly total return data from Callan Associates I tested the 2007-2016 period using the tickers listed in Figure 2. The results appear in Figure 3.
Figure 3 – Equity Curve for Jay’s One Asset Class per Month Strategy; 5/31/2007-10/31/2016
*The average annual gain starting in 2008 (the 1st full year of data) is +25.8%
*The maximum drawdown (using monthly data) is -11%.
Annual results in appear in Figure 4. These results do not include any transaction fees
Figure 4 – JOAC ETF Strategy Annual Results
*May 31st/2007-12/31/2007
So is this the greatest thing since sliced bread? Probably not. Why not? Time for more of those pesky caveats:
*Buying and holding only one ETF per month does not offer a lot of diversification (or any diversification at all for that matter)
*The test period using ETFs is relatively short
*Intramonth volatility and drawdowns will undoubtedly be greater than what appears in the Figures above
This strategy fits squarely in the “(almost certainly) high risk, (potentially) high reward” category.
Summary
So as I stated earlier, no one should assume that they can just start buying the ETFs listed above and start making 25% a year ad infinitum into the future. The results displayed in this article should probably be thought of more as a starting point for further analysis rather than a finished product.
In essence, the real point is that – as with all things – there is a time and a place or everything, including (apparently) asset classes.
Nov 11, 2016 | bonds, chart patterns, educational newsletters, ETFs, indexes, jay kaeppel
In real estate, it’s “Location, Location, Location.” In the financial markets it’s “the Trend, the Trend, the Trend.” There is a great deal of certainty about what will happen next in stocks, bonds and gold. But the key to successfully navigating these turbulent times starts not with predicting the future but rather with identifying the current trend in the here and now and going from there. So let’s take a look at, well, what else, the trends.
I have certain trend-following models that I follow to help me to determine which way to be leaning in the markets. Like any trend-following method they are far from perfect (my stock market model for example, suffered not one but two significant whipsaws in the last year+). But for me there is no expectation that they will be perfect. The only goal is to catch most of the upside during major bull markets, and miss much of the downside during major bear markets.
Stocks
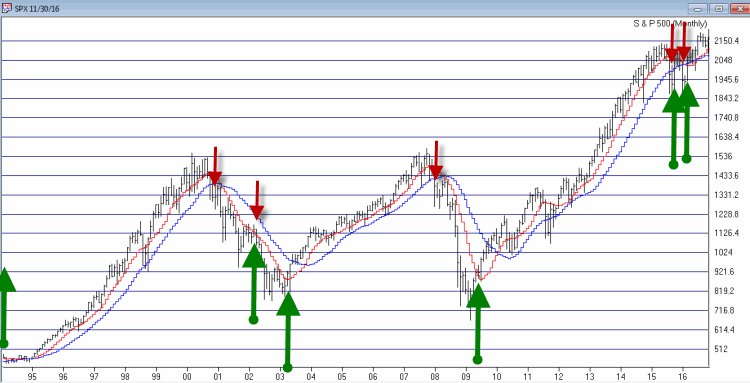
For stocks I look at the 10-month and 21-month moving averages for the S&P 500 Index and use the following rules:
*A sell signal occurs when the S&P 500 closes 2 consecutive months below its 21-month moving average AND is also below its 10-month moving average
*Following a sell signal a new buy signal occurs when the S&P 500 registers a monthly close above its 10-month moving average
Figure 1 – Stock Market trend-following signals (Courtesy TradingExpert)
This method avoided much of the 1973-1974, 2000-2002 and 2008 bear market destruction. That’s the good news. The bad news is that it sold at the end of September 2015 and at the end of February 2016 – both just prior to powerful upside reversals (like I said, trend-following models ain’t perfect).
The most recent signal was a buy signal on 3/31/2016.
So the trend for stocks is presently BULLISH
Bonds
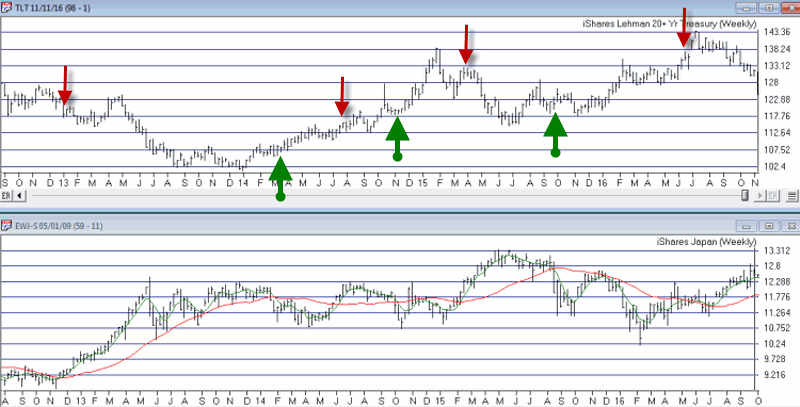
I have written several posts about this in the past. My favorite bond timing indicator is Japanese stocks. No seriously. They have a string tendency to trade inversely to the 30-yr US t-bond. I track ticker EWJ and watch the 5-week and 30-week moving averages. Because Japanese stocks and t-bonds trade inversely I use the following rules:
*A buy signal for bonds occurs when the 5-week moving average for EWJ drops below the 30-week moving average for EWJ
*A sell signal for bonds occurs when the 5-week moving average for EWJ rises above the 30-week moving average for EWJ
The most recent signal was a sell signal for t-bonds on 6/10/2016
So the trend for bonds is presently BEARISH
Figure 2 – Bond trend-following signals(Courtesy TradingExpert)
Gold
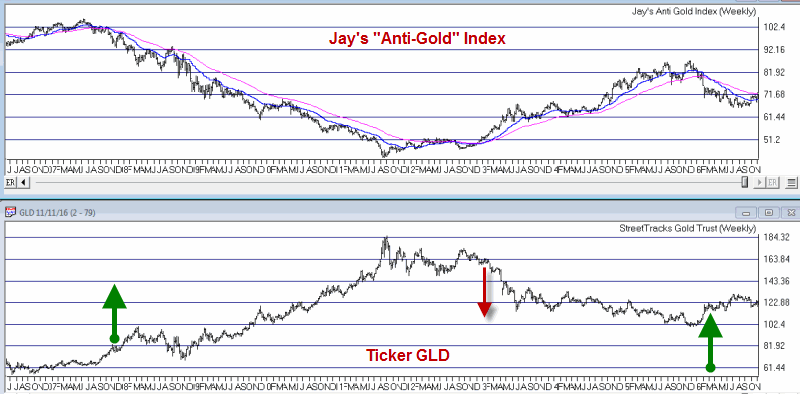
For gold I use two moving averages on a weekly chart for something I refer to as Jay’s Anti-Gold Index. Rather than go into a long explanation I will link to the
original article on the topic and offer a short explanation. In AIQ TradingExpert I created a ticker comprised of 4 other tickers (GLL, RYSDX, SPX and YCS) which all trade in a negatively correlated manner to the price of gold (er, usually).
One moving average I call the “FrontWeighted36DayMA” (“FrontWeightedMA” for short. The calculations are based on someone else’s work – unfortunately I cannot recall the person’s name so cannot give proper credit. Hopefully Karma will work and somewhere that person will Have a Nice Day without really knowing why. The calculations are a bit long-winded so the AIQ TradingExpert code appears at the end of this article.
The other is the 55-week exponential moving average.
(CAVEAT: Because some of these tickers did not exist until 2006 trading signals began on 12/31/1996, so yes, it is by my standards a relatively short test period for a long -term moving average method. To put it another way, don’t bet the ranch on gold basedon this one indicator)
The trading rules are as follows:
*When the FrontWeightedMA closes a week BELOW the 55-week MA then a BUY signal for gold occurs.
*When the FrontWeightedMA closes a week ABOVE the 55-week MA then a BUY signal for gold occurs.
Figure 3 – Gold Trading Signals (Courtesy TradingExpert)
The most recent signal was a buy signal on 3/18/16.
So the trend for gold is presently BULLISH.
Summary
These indicators represent “my opinion as to where the markets are headed next” (because the truth is I don’t know). There are objective, mechanical measures of where things stand today. Nothing more, nothing less.
Also, none these indicators falls into the “World Beater” or “You Can’t Lose in Investing” categories. But then again they are not really designed to (BTW if you do posses methods that do fit into either of the aforementioned categories, I would love to hear from you – off the record, of course). What they do achieve is to offer a decent frame of reference during times of doubt.
And that is one of the most powerful tools any investor can possess.
So in sum, the current trend (at least according to what you’ve seen here) for stocks and gold is bullish and the current trend for bonds is bearish.
How long any of these trends will remain in place is anyone’s guess. So enjoy them while they last.
Jay Kaeppel
Chief Market Analyst at JayOnTheMarkets.com
Jun 16, 2014 | bonds, trading strategies
With the Fed “pumpin’” and the economy “thumpin’” (as in “thumping along like a flat tire”) it seems unlikely that interest rates would rise. Still, sometimes is makes sense to go against the grain if enough evidence presents itself. So let me show you what I am looking at in the bond market.
EWJ vs. T-Bonds
As I wrote about in a previous article (T-Bonds and Japanese Stocks, Inversely….), for whatever reason, t-bonds have long exhibited a strong inverse correlation to Japanese stocks (no, seriously). In Figure 1 we see EWJ (the ETF that tracks Japanese stocks) with a 5 week and 30 week moving average drawn in the top clip. In the bottom clip we see ticker TLT (the ETF that tracks the 30-year t-bond). You can see that – using highly technical terms that we quantitative analysts types like to use to impress others with how much we know about the markets – when EWJ “zigs”, TLT tends to “zag”, and vice versa.
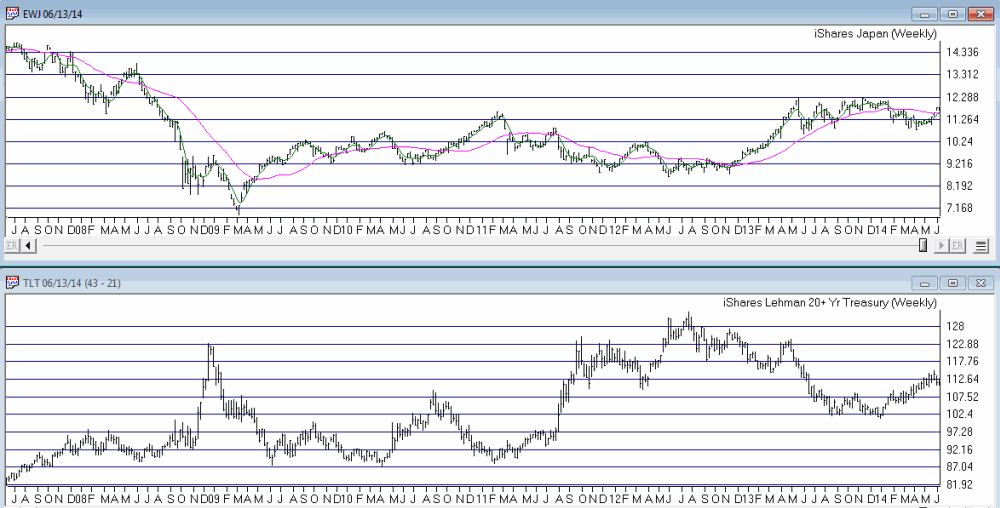
Figure 1 – EWJ with 5-30 week moving averages versus TLT (Courtesy: AIQ TradingExpert)
This past weekend the 5-week moving average for EWJ once again rose back above the 30-week moving average for EWJ. If history is an accurate guide then this may be a negative sign for t-bonds. Although I would be remiss if I did not invoke:
Jay’s Trading Maxim #216: History is not always an accurate guide (but it beats flipping a coin).
Figure 2 displays the raw dollar gain or loss from:
a) Holding a long position in t-bond futures (1 point movement = $1,000) when EWJ 5-week is below EWJ 30-week (red line)
b) Holding a long position in t-bond futures (1 point movement = $1,000) when EWJ 5-week is above EWJ 30-week (blue line)
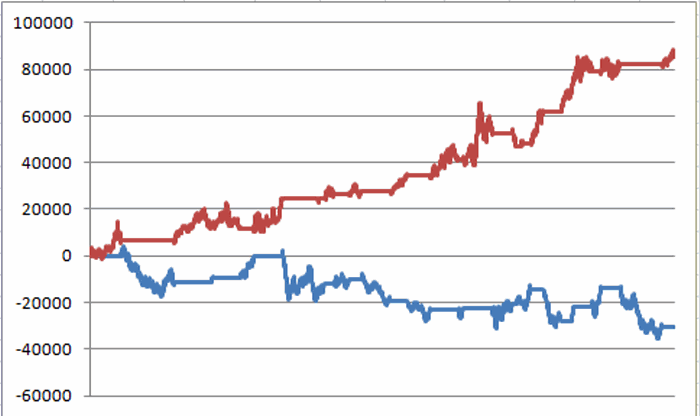
Figure 2 – $(-) from a long position in t-bonds futures when EWJ 5-week MA is BELOW EWJ 30-week MA (red line) and $(-) from a long position in t-bonds futures when EWJ 5-week MA is ABOVE EWJ 30-week MA (blue line) (12/31/1997 to present)
Obviously this indicator is not perfect, but equally obvious is the fact that bonds have typically performed better when the EWJ 5-week MA is below that EWJ 30-week MA. So let’s call this – if nothing else – a potentially negative sign.
TLT vs. Elliott Wave
I am not a true “ElliottHead” but I do tend to pay attention to the Elliott Wave count for a given market when the daily and weekly counts point in the same direction. Figures 3 and 4 present the latest daily and weekly Elliott Wave counts for TLT as figured by ProfitSource by HUBB.
The daily count just completed a bullish Wave 5 (i.e., implying that the latest rally has run its course) and the weekly count is signaling a potentially Bearish Wave 4 sell signal. For the record, I do not believe in the “magic” of Elliott Wave. But I do like when daily and weekly signs for just about any indicator appear to confirm one another.
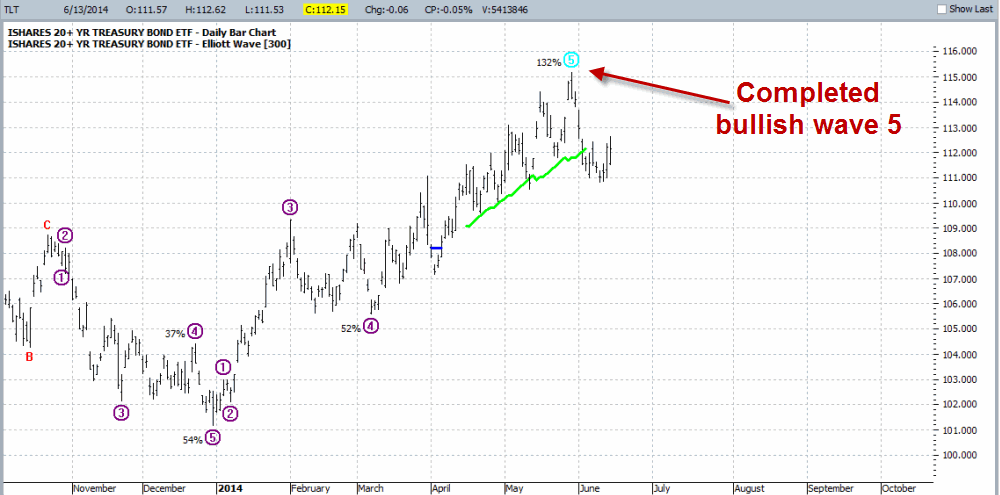
Figure 3 – Daily Elliott Wave Count for TLT; Completed Wave 5 suggests rally is over (Courtesy: ProfitSource by HUBB)
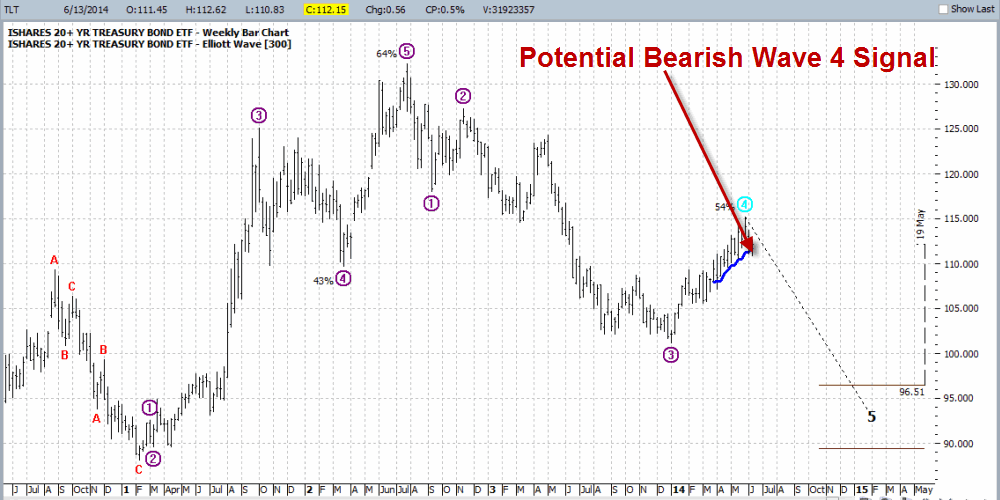
Figure 4 – Weekly Elliott Wave Count for TLT; signaling potentially Bearish Wave 5 signal (Courtesy: ProfitSource by HUBB)
Ways to Play
So if a trader buys the idea that t-bonds will decline in price in the months ahead, there are lots of way to play. A trader could:
*Sell short 100 shares of ticker TLT. This would require roughly $5850 of margin money and would technically entail unlimited risk.
*Trader could buy 100 shares of ticker TBT, an inverse leveraged ETF that is designed to track t-bonds times minus 2 (In other words, if bonds decline -1%, then ticker TBT should rally roughly +2%). This would require roughly $6,200.
*Buy a put option on ticker TLT.
*Buy a call option on ticker TBT.
There are pros and cons to each, but the trade that I want to highlight is buying a call on ticker TBT.
Call on TBT
If t-bonds do decline, then TBT would be expected to advance, hence the reason for considering a call option on TBT. The reason I am looking at this trade is simply because it offers the most “bang for the buck.” Not only are TBT shares leveraged 2 to 1, but by buying a call option we can obtain even more leverage with limited risk. As you can see in Figure 5, TBT has support at roughly $56 and resistance at roughly $80.
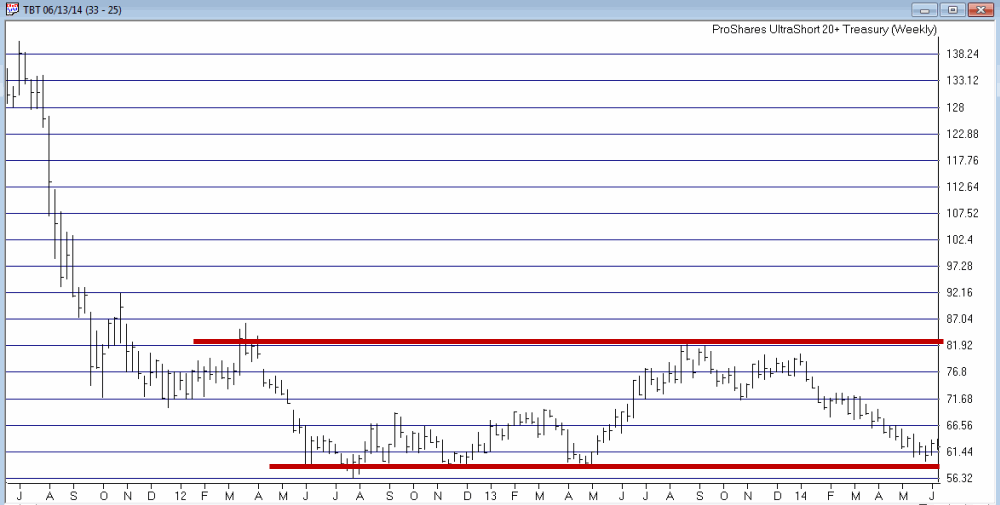
Figure 5 – TBT; support near $56, resistance near $80 (Courtesy: AIQ TradingExpert)
So let’s look at buying the September 62 call for $281 (NOTE: the bid/ask is fairly wide at $2.62/$2.81. For illustrative purpose I am simply assuming a market order and a fill at $2.81. An astute trade might consider a limit order that splits the difference). Figure 6 displays the risk curves for buying the Sep TBT 62 call at $2.81.
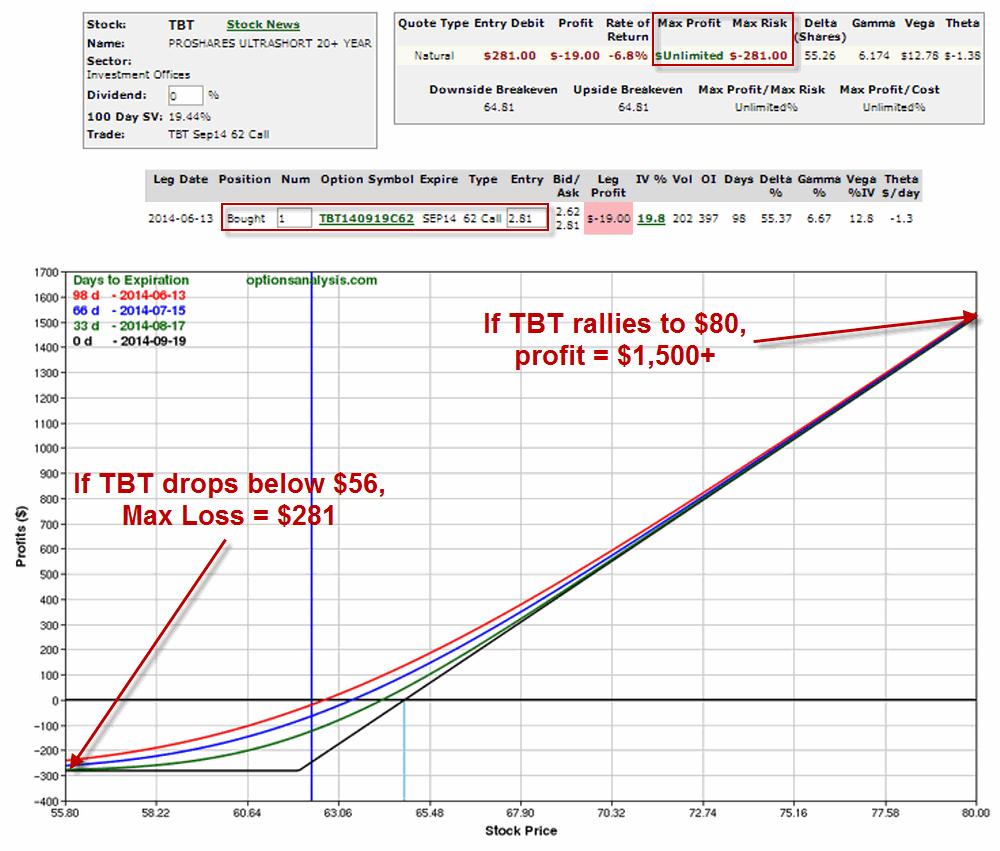
As you can see, in the worst case the maximum loss is $281. In the best case – i.e., TBT rallies all the way back up to $80, the trade can generate a profit in excess of $1,500. Also there are three months for “something” to happen.
Summary
As always, I am not “recommending” this trade. I am simply pointing out some potentially bearish evidence that I have found in regards to t-bonds and have highlighted “one way” to play such a situation using the limited risk associated with options.
So will t-bonds take a tumble and in turn, will TBT soar, thus generating an excellent rate of return? As always, “It beats the heck out of me.” But from a trader’s perspective, the real question is, “Am I willing to risk $281 to find out?”
Jay Kaeppel
Chief Market Analyst at JayOnTheMarkets.com and AIQ TradingExpert Pro (http://www.aiq.com) client
Jay has published four books on futures, option and stock trading. He was Head Trader for a CTA from 1995 through 2003. As a computer programmer, he co-developed trading software that was voted “Best Option Trading System” six consecutive years by readers of Technical Analysis of Stocks and Commodities magazine. A featured speaker and instructor at live and on-line trading seminars, he has authored over 30 articles in Technical Analysis of Stocks and Commodities magazine, Active Trader magazine, Futures & Options magazine and on-line at www.Investopedia.com.
Jun 5, 2014 | bonds, trading strategies
Watching Weekly Dow Momentum
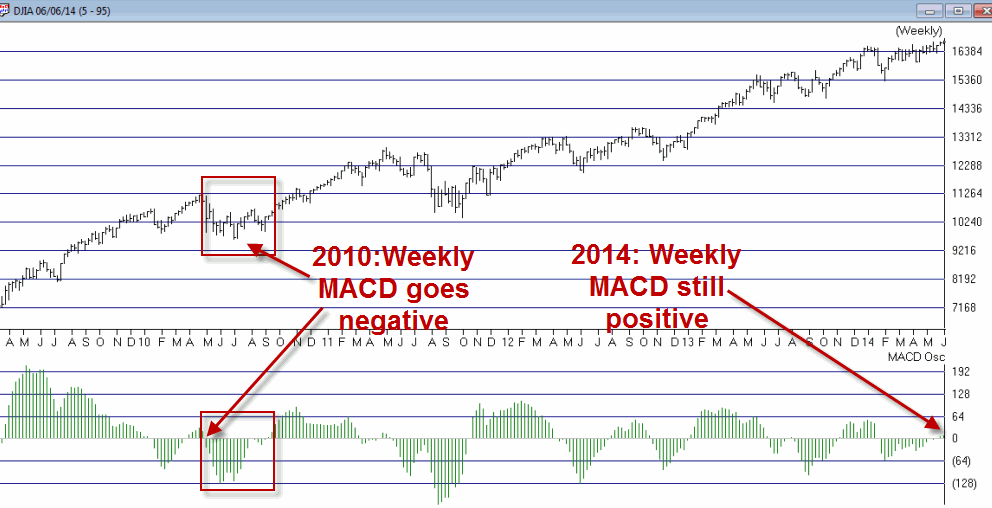
The stock market – like the Energizer Bunny – just keeps chugging along, with the Dow, the S&P 500 and the Nasdaq 100 all touching new highs in the last week (the Russell 2000 small-cap index is another story, and may ultimately serve as the “canary in the coal mine”, but for now “majority rules”). So for now, disciplined trend-followers (“Hi my name is Jay – although it is a little difficult to speak at the moment as my teeth remain tightly clenched”) have done well to avoid all of the “Sell in May” warnings from all of those so called experts (“Um, hi my name is Jay?”). But there is one sign that I think investors should follow that has historically proven useful during the middle months of mid-term election years.
I first wrote about this on 5/6/2014 in an article titled “A Warning Sign to Watch“. For full details I suggest you read that article, but for now let me give you the gist.
-Between May and October of mid-term election years, a warning sign occurs when the MACD Oscillator (many traders refer to it as the MACD Histogram) drops into negative territory.
Figure 1 – Weekly Dow Industrials with MACD Oscillator (watch for drop to negative territory) courtesy AIQ TradingExpert
For the record, the MACD Oscillator was below 0 during early May, but was in a rising trend along with the Dow itself. The Oscillator returned to positive territory on 5/23 and remains there still. So let me sum up my advice as succinctly as possible:
*KEEP AN EYE ON THE WEEKLY MACD OSCILLATOR FOR THE DOW JONES INDUSTRIALS AVERAGE.
If it drops into negative territory be prepared to take defensive action.
If you have even the most basic charting software, checking the status of the weekly Dow MACD Oscillator after the close each week will take up approximately 12 seconds of your time. Per the 5/6/14 article, if history is any guide, the 12 seconds a week time investment may prove to be very useful.
Looking for a Reversal in T-Bonds
As I write, t-bonds are in the middle of a nasty short-term sell off. But there is hope. As I wrote about on 4/8/14 in an article titled “A Simple Signal for Bond Traders”, a short-term bullish setup may be forming at the moment. In a nutshell:
*When the 25-day moving average for ticker EWJ is below the 150-day moving average for ticker EWJ (long story short, t-bonds tend to trade inversely to Japanese stocks – go figure), then
*Wait for the 10-day CCI (Commodity Channel Index) for ticker TLT to drop below -100 and then turn up for one day.
Once that occurs a trader might consider buying the call option with at least 40 days left until expiration and the highest gamma among call options for that expiration.
In Figure 2 you can see that this setup is presently “locked and loaded” and will be triggered when the 10-day CCI for ticker TLT reverses back to the upside.
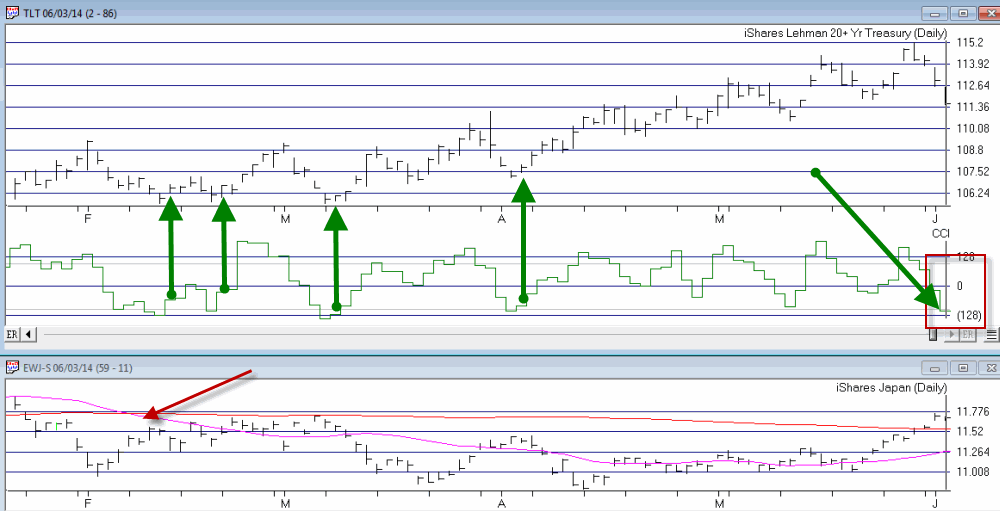
Figure 2 – TLT forming a potentially bullish setup courtesy AIQ TradingExpert Pro
Traders should always remember that there is never any guarantee that the next signal will generate a profit, and should always have some sort of stop-loss or risk limiting planin place at the time that any new trade is entered.
Jay Kaeppel
Chief Market Analyst at JayOnTheMarkets.com and AIQ TradingExpert Pro (http://www.aiq.com) client
Jay has published four books on futures, option and stock trading. He was Head Trader for a CTA from 1995 through 2003. As a computer programmer, he co-developed trading software that was voted “Best Option Trading System” six consecutive years by readers of Technical Analysis of Stocks and Commodities magazine. A featured speaker and instructor at live and on-line trading seminars, he has authored over 30 articles in Technical Analysis of Stocks and Commodities magazine, Active Trader magazine, Futures & Options magazine and on-line at www.Investopedia.com.