Jul 28, 2016 | educational newsletters, jay kaeppel, seasonal
We are entering an “interesting” time of year for investors (Unfortunately, that’s “Interesting” as in the ancient Chinese curse stating “May you live in interesting times”).
Now I personally I have no idea if the stock market is going to break out to the upside and rally to further new highs or if this latest lull will be followed by a painful reversal of fortune. I am willing to play the long side as long as things are holding up/moving in the right direction. But investors should be aware that the August/September timeframe is the “Danger Zone” for the stock market historically.
August/September Historically
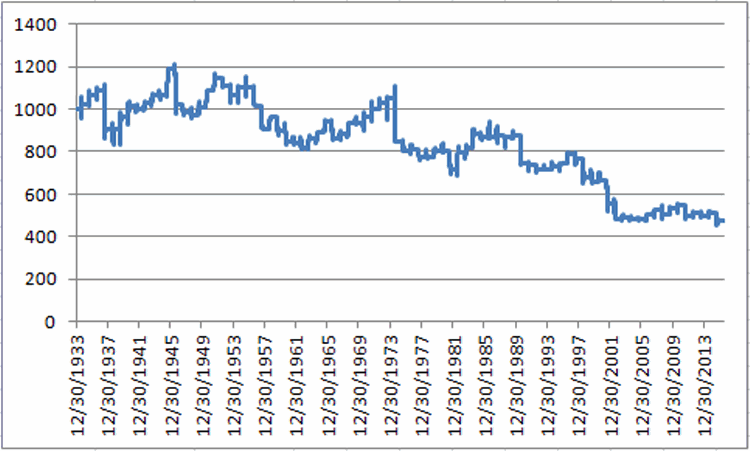
Figure 1 speaks for itself. The chart displays the growth of $1000 invested in the Dow Jones Industrials Average only during the months of August and September every year starting in1934.
Figure 1 – Growth of $1,000 invested in Dow Jones Industrials Average (using price data only) ONLY during August and September; 12/31/1933-present
Two key takeaways:
*The net result has been a loss of -53% or the past 82 year. Not exactly the kind of returns most of us are looking for.
HOWEVER
*Despite the negative net results, the fact is that the Aug/Sep period has showed a gain more often (45 times) than not (37 times).
So while caution appears to be in order, no one should assume that the next two months are doomed to show a loss.
Stocks versus Bonds
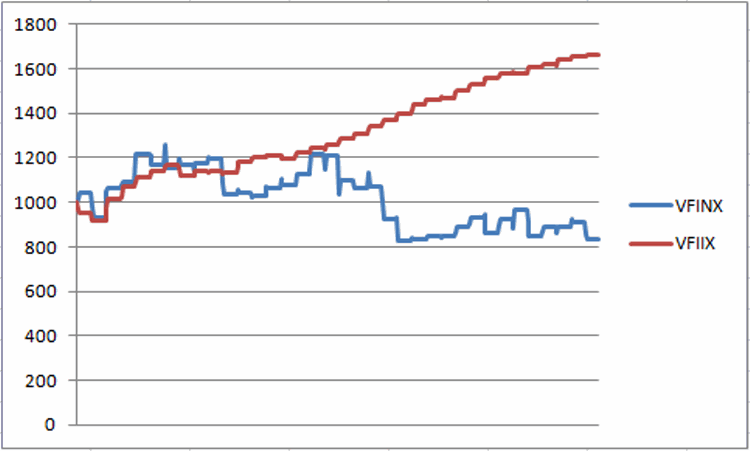
Figure 2 compares the performance of:
Ticker VFINX – Vanguard S&P 500 Index fund
*Ticker VFIIX – Vanguard Mortgage Bond Fund
(*VFIIX is used as a proxy for intermediate-term treasuries as it has a high correlation to IT treasuries and a longer data history. Any short-to-intermediate term treasury fund or ETF would likely produce similar results)
The test starts in 1980 (when VFIIX started trading) and shows the total return for buying and holding each fund ONLY during the months of August and September each year since.
Figure 2 – Growth of $1,000 invested in VFINX (stocks; blue line) versus VFIIX (bonds; red line); August 1980 to present
Summary
So what will it be this year? A breakout to new highs? Or something much worse? I wish I could tell you the answer. But at least now you have some information to help guide your “speculative” versus “conservative” instincts in the months ahead.
Jay Kaeppel
Jul 26, 2016 | chart patterns, EDS, stock market
Why add Chart Pattern to your TradingExpert Pro?
- 16 different patterns tracked
- 6 gauges of each pattern's quality
- Automatically generate report every night
- Built in EDS file so you can backtest and add to your own strategy
- Completed and emerging patterns
OR CALL AIQ SALES on 1-800-332-2999 or 775-832-2798
LOCK in 2008 pricing
If you order before July 31, 2016
you'll get the 2008 pricing!
OR CALL AIQ SALES on 1-800-332-2999 or 775-832-2798
Jul 13, 2016 | educational newsletters, fundamental analysis
Dividends for U.S. companies continue to be under pressure as fewer issues are increasing payments and those issues that do increase do so at a lower rate. Within the S&P 500®, the average dividend increase for Q2 2016 was +10.56%, down from +10.62% in Q1 2016 and +13.08% for all of 2015. The pace of dividend cuts continues to rise, as Q2 saw a substantial increase in cuts from mid and small-cap energy issues, with the overall aggregate dollar 12-month cuts rising 157% over the prior 12-month period. Yet, the over-all dividend increases continue to outweigh the decreases. So the outlook remains positive.
Energy and Materials issues are expected to remain under pressure for 2016, potentially resulting in disappointing announcements for earnings, capital investments, buybacks and dividends. Assuming dividend policies remain unchanged, the U.S. equity market in 2016 is positioned to set another record in payments, especially in the S&P 500®, but the increase is seen as being in the mid-single digit range, not the double-digits seen over the past few years.
The good news for dividends is that, while things are difficult, the majority of issues continue to increase and have the resources to do so for the near future.
Large, Mid, Small Caps
Within the S&P 500®, 418 issues, or 82.8% currently pay a dividend. All 30 members of the Dow Jones Industrial Average® pay a dividend as well.
Within the S&P Mid Cap 400®, 69.3% of the issues within pay a cash dividend, a decrease from 70.3% in Q1 2016. Within the S&P Small Cap 600®, 51.4% of the issues pay a dividend, which is unchanged from Q1 2016.
Yields continued to vary among the various market indices.
Large-Caps at 2.17% (no change from the 2.17% in Q1 2016).
Mid-Caps at 1.68% (1.69% in Q1 2016).
Small-Caps at 1.38% (1.47% in Q1 2016).
The yields across dividend paying market-size classifications continue to be compatible, with large-caps coming in at 2.54% (the same as Q1 2016), mid-caps at 2.37% (2.36% in Q1 2016) and small-caps at 2.47% (2.50% in Q1 2016).
Contributed by Top Stock Analyzer
Stocks which received upward revisions to current year consensus earnings estimates and show a lower uncertainty of earnings tend to outperform over time…..LEARN MORE
Jul 11, 2016 | educational newsletters, market timing, one minute stock
The Dow rallied for 251 points on Friday, closing at 18,147. It was up 197 points for the week. The NASDAQ finished up 80 points on Friday and up 94 points for the week.
After the BLS said that 287K new jobs were created in June, the market shot up and tested the April 20 high. The Dow actually came within one point of making a new high before pulling back from overbought conditions.
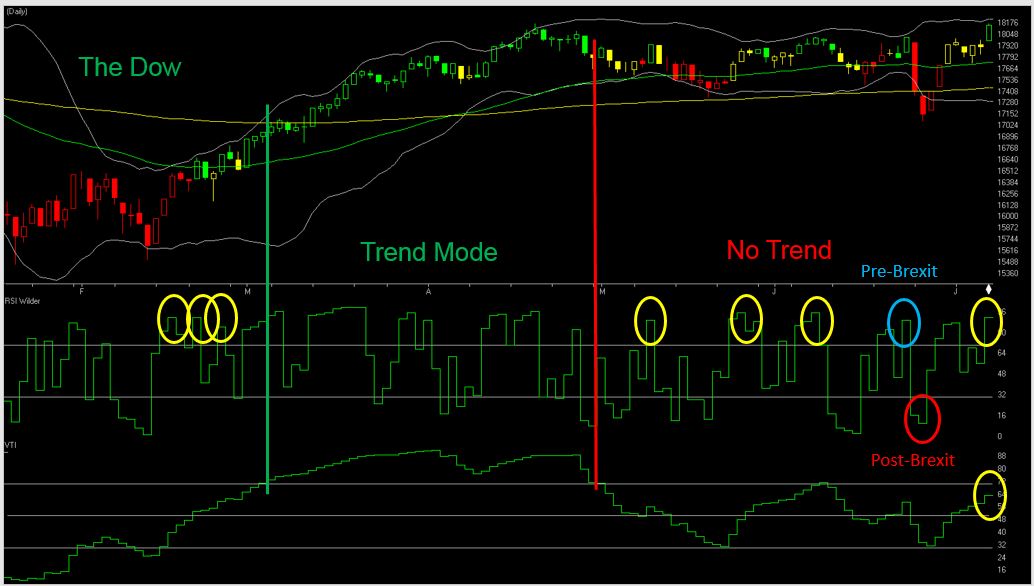
This week I’m posting three charts that show where the Dow, Gold, and the Dollar are in their current patterns.
The first chart of the Dow shows that once again, the 2-period RSI Wilder is overbought with No Trend in place. So the Dow should start to pull back early next week.
Gold and the Dollar are another matter. As you can see from the second chart, GLD continues to remain in a strong uptrend. The VTI is above the 70 level and continues to move higher. GLD closed at 130.52 on Friday and appears to be right on track for a move to the 134+ level.
But the chart of the Dollar shows a fly in the ointment. For the past three days, the VTI on the chart of UUP is showing that it is also starting to enter the Trend Mode. This is a major concern, because it is extremely unusual for the Dollar and Gold to be rising at the same time. The only time this tends to happen is when there is major trouble in the world.
It happens because people are so concerned about their money that they are flocking to safe havens. And it’s not only happening with individual investors, it’s happening with companies too. We’re seeing this in a lot of European countries now where investors are willing to pay the banks money (negative interest) just so they can get their money back at some point in the future. It’s insane!
Prior to Brexit, I warned that this could happen. I said U.S stocks, gold and the Dollar could be perceived as safe havens, and all three could rise post-Brexit. But I don’t believe this condition will last. Something has to give. A strong dollar makes it extremely difficult for most U.S. companies to sell their products abroad. It will impact their earnings. There are no two ways about it. As long as the dollar continues to rise, large cap U.S. stocks will face strong headwinds.
And right now, most U.S. stocks are not cheap. The current P/E ratio for the S&P500 is a whopping 24.61! Compare this to its historic mean of 15.60 and you will quickly see that stocks are severely overvalued. The reason they are being priced so high now is because companies are buying back shares, and investors are being pushed into stocks because most other investments are paying diddly squat. This is a very dangerous situation.
The fact that most companies are buying back their own shares is really something you should think about. Usually the only time a company buys back its own shares is because they believe the stock price is too cheap! The stock price might have been reduced because of a temporary slip in earnings or some unusual one time event. In normal times, a company would not do this. In normal times, a company would use any excess cash it generates to expand. They would buy additional equipment or hire more people. After all, they’re in business to make money. But this is NOT happening now. The reason its not happening now is because companies are worried. They are not buying new equipment or hiring new workers despite the fact that the June Jobs Report was positive. Given May’s horrible report of only 34K new jobs and its subsequent downward revision to 11K, the June report MUST be considered suspect.
So think about this. If a company is worried about its future, doesn’t it seem strange to pay on average, 25 times earnings to buy back its stock? If they were buying back stock at 10-12 tries earnings, I could understand. But at 25 times earnings, buying back shares is not a strange strategy, it’s crazy!
It’s a strategy that can support the price of the stock for a while, but longer term, it’s not something that will lead to actual growth. I also believe it’s a very risky strategy. Share buyback programs and cost cutting measures are temporary accounting tricks. They make the price of a stock seem attractive to unsuspecting investors, especially seniors, who are being forced into the stock market because they need income (dividends). But eventually, if companies are going to keep their share price supported, they will have to show profits produced by real growth. With earnings season about to begin next week, and an overbought market, it should be interesting to watch what what happens as these companies report.
Protect yourself.
That’s what I’m doing,
The Professor
Jul 7, 2016 | earnings, educational newsletters, fundamental analysis, Top Stock analyzer
Have you ever bought a stock you thought had great earnings, only to see it fail miserably?
It is not enough to have a list of great fundamental stocks. You must go deeper into the analysis of each final candidate on the list. But, what other analysis can be done? At Top Stock Analyzer we use our own proprietary tool, we call the the FATI® Score to help us unlock profits.
The FATI® Score is based upon leading investment research studies which show stocks with a lower standard deviation of earnings estimates from the consensus (higher degree of agreement among analysts) the better performance of the stock.
The study concluded stocks with a higher degree of earnings certainty (lower standard deviation of estimates) outperformed stocks with a lower degree of earnings certainty by +8.7% per year over a fifteen-year period. That is a significant performance enhancement. One which cannot be ignored.
With out FATI® Score we fine tune stock selection beyond a list of great fundamentally screened stocks. There is no magic here, nor any guarantees, but face it; investing is hard enough. Why not select stocks which have a high probability of outperforming the markets both long and short?
Each week we generate a report of high scoring stocks both long and short, then feature one stock for an in-depth analysis.
Here’s an excerpt from our May 30, 2016 newsletter and the long stock that the FATI® Score highlighted
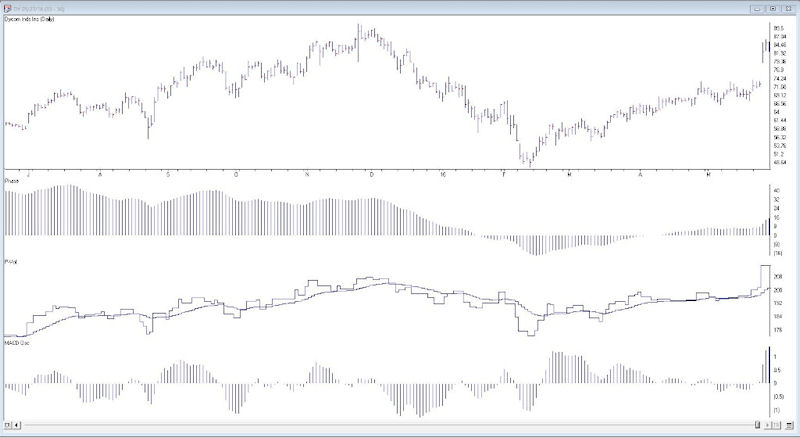
Featured Stock – Dycom Industries – DY
Industry – Heavy Construction
Dycom Indiustries is a specialty contracting firm servicing
the telecom and utilities industries. The firm provides engineering, construction and maintenance services. They
have a long list of prominent clients, such as AT&T, Verizon, Comcast and Century Link.
Dycom is experiencing enormous
growth due to the high demand for network and mobile bandwidth. As the bandwidth demand grows, customers need to
expand the capacity of their networks. This demand has created a backlog of over $5.6 billion is contract work
for Dycom. With this years sales growth estimated at over 26% earnings should continue to be outstanding.
As of 7/6/2016 DY was up 6.59%
Here’s an excerpt from our June 6, 2016 newsletter and the long stock that the FATI® Score highlighted
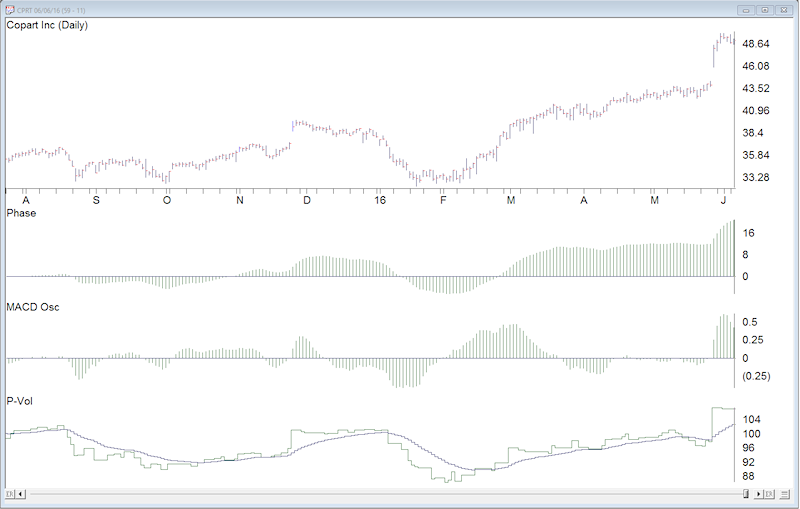
Featured Stock – Copart, Inc. – CPRT
Industry – Auction/Valuation Services
Copart, Inc. provides online auction and related services to
process or sell salvage and marketable vehicles. The buyers and sellers include
insurance companies, banks and financial institutions, car dealerships, fleet
operators, and vehicle rental companies, licensed dealers and of course the
general public as well.
The company’s operations span the globe. Operations are well
established in Canada, Europe, South America and India. With increasing
revenues. declining expenses and global expansion into the Middle East, Copart
has been hitting on all cylinders. So far in 2016 the company has added 4 new
facilities to handle the increase in volume. Two in Colorado and two in Texas.
Earnings revisions are strong and are coming in higher
across quarterly and annual estimates. With a three year projected EPS growth
rate of 27% the party is not over yet. The P/E of 23 may sound expensive on a
relative basis, but with its EPS growth rate, it is actually reasonable.
As of 7/6/2016 CPRT was up 1.15%
The ‘Short Side’ List
We also analyze for candidates to consider shorting for downward trending markets. The criterion for screening is not exactly the opposite of the long screen. To be most effective with the short list and minimize your risk associated with shorting, it is best to look for newcomers to the short list on a weekly basis.
Remember, shorting is an advanced trading technique. You have unlimited loss potential, so remember to be selective, use a stop loss order and only short in a confirmed downward trending market.
Here’s an excerpt from our June 13, 2016 newsletter and the short stock that the FATI® Score highlighted
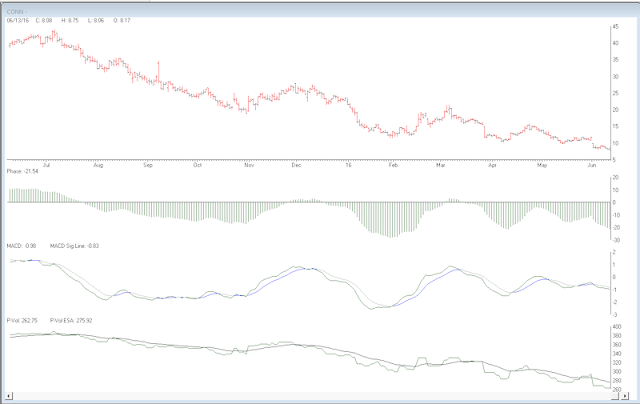
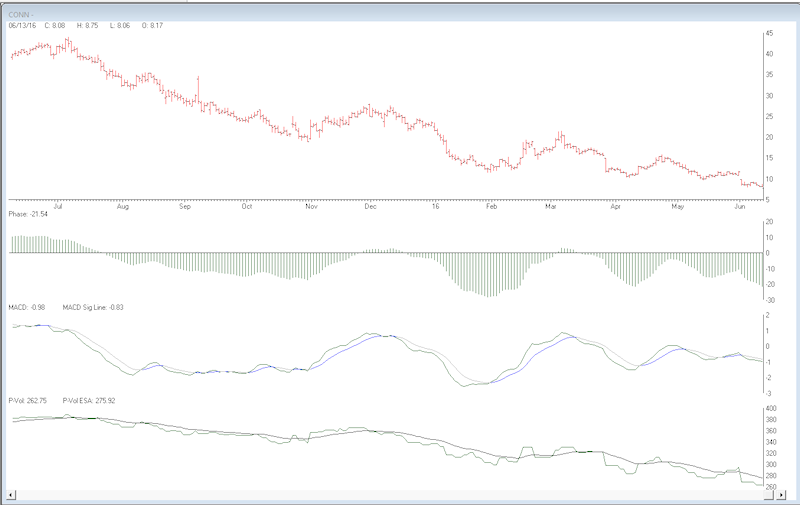
Featured Stock – Conn, Inc. – CONN
Industry – Specialty Retailer
Conn, Inc is a regional specialty retailer in the southern
part of the U.S., in particular Texas and Louisiana. They sell home appliance
and garden equipment along with an array of other electronics. The company has
seen their gross margin severely impact by the rising cost of goods. In
addition their interest expense has doubled over the past year. These items, as
well as others have cause a severe contraction in earnings.
There doesn’t seem to be any daylight coming for Conn.
Earnings are expected to decline -89% this year, the P/E stands at 73 and F1
estimates have fallen from $1.77 to $0.11 over the past 90 days. Of the six
analysts following the stock, there doesn’t appear to be any agreement on the
actual EPS as depicted in a FATI Score of 534. Remember, anything over a score
of 12 or higher is disqualified from our long recommendations list.
With a pending market decline and the growing deterioration
of Conn, Inc. fundamentals, we see this as a good shorting opportunity. As with
any short trade, place a stop order and monitor the stock daily.
As of 7/6/2016 CONN was up 12.73%
Putting it All Together
There you have it. “Fundamentals Made Simple”. Just select your stocks from the list and go right into your technical analysis. All the fundamental screening has already been done for you. Each and every week you will receive an updated screening of Top Stock Analyzer with the power of the FATI® Score. You can see the score of each stock.
Here’s our featured stock performance as of 7/6/2016
Our weekly newsletter is a collaboration between AIQ Systems LLC and Fortunatus Advisors, Inc. if you want to learn more about our service visit




 English