
You may have seen some of the articles out there analyzing the skewed nature of the current market rally. As Joe Bartosiewicz in his August 8 Bartometer pointed out:
“The Top 15 Stocks in the S&P 500 account in Market Value 35% of the entire S&P 500 stock market. The Bottom 420 Stocks in the S&P 500 account in Market Value 33.8% of the entire S&P 500 stock market. This means that 15 stocks are controlling the entire S&P 500..”
The Dow Jones 30 index uses a price weighted criteria as part of it’s calculation, and also includes Apple; AAPL has more than doubled in price in under 5 months.
Given that there appears to be only a small basket of stocks leading this rally, we had a look back at the last time tech related stocks were driving the market higher; the dotcom bubble that ran through the 90s into the early 00s.
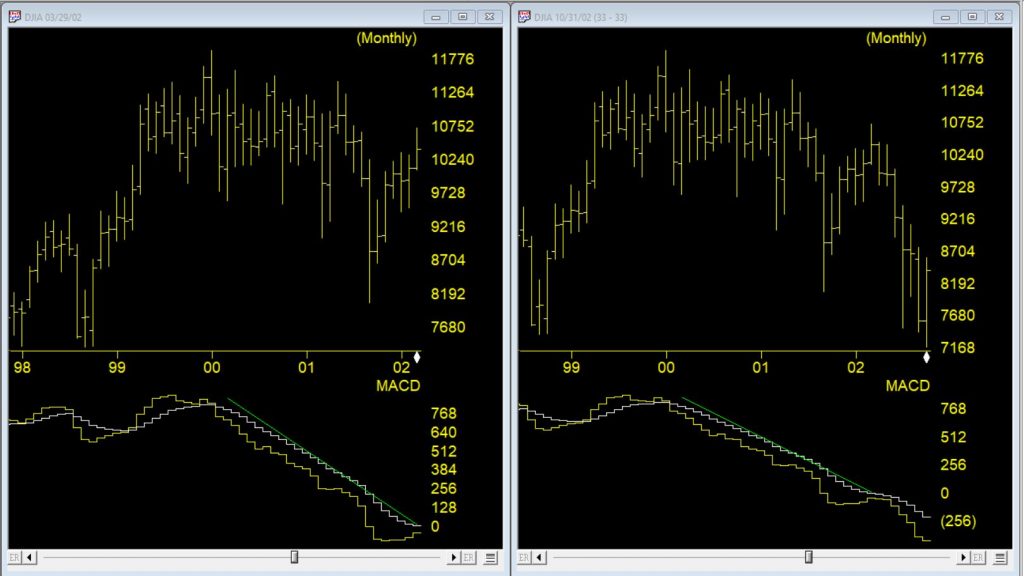
The first chart is a monthly of the Dow 30 with MACD indicator comparing the market 03/29//2002 as the dotcom bubble rolled over vs 7 months later. Students of divergence analysis, will tell you that MACD in late March 2002 clearly showed prices should be much lower still despite the @33 % rally from the September 2001 low. By late October 2002 the market had fallen again by @33%. At that time the market was close to @40% lower than the high at the start of 2000.
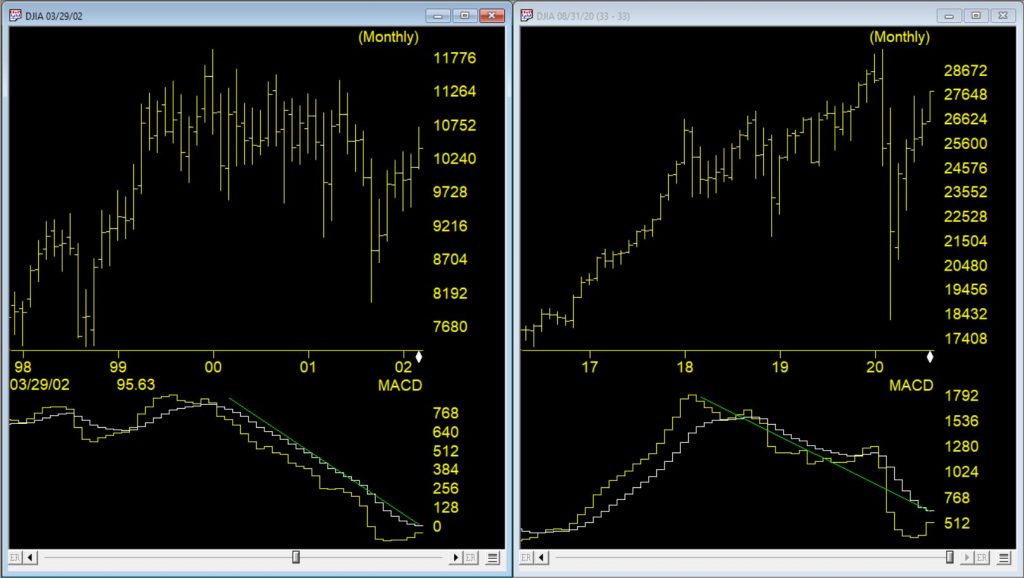
The second chart is a monthly of the Dow 30 on the right through 8/10/20 vs the rally peak of 03/29/2002. The current market has had a @50% rally from the low at the end of March 2020. The original correction was @37% from high to low, slightly bigger than the dotcom correction. The MACD, similar to 2002, is strongly diverging.
The decline in 2002, after the rally, took prices lower than the the prior bottom. If a similar pattern happens this time and the decline is @40% from the high of 29568, the Dow would at the 17700 level.