Feb 11, 2014 | Reports, Support
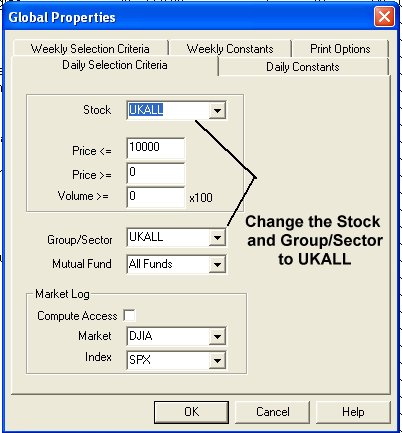
Open the Reports from the Charts Tool Bar. From the Reports menu, select Global Properties. Change the Stock and Group/Sector areas to UKALL in the Daily Selection Criteria tab. Repeat for the Weekly Selection Criteria tab if desired. Click OK. When you next download data and/or generate reports, the reports will reflect the changes.
Feb 4, 2014 | Charts, Expert Design Studio, Support
Copy and paste the code below to a New EDS file. Click on File, Save, name it Bothvolumeandcloseupdown.eds
PosVol if [volume]>val([volume],1).
NegVol if [volume]<val([volume],1).
PosClose if [close]>val([close],1).
NegClose if [close]<val([close],1).
Phasedown if Val([Phase],2)< Val([phase],1) and Val([Phase],1)> [Phase].
Phaseup if Val([Phase],2)> Val([phase],1) and Val([Phase],1)< [Phase].
Go to Charts
Click on the “Define Studies” button (up top)
Where it shows EDS Files up top…click on the button that looks like it has three periods in it (…)
Browse and select the Both Volume and Close UP Down.EDS file
Click on “Create New Color Study”
Select “Price Plot” and click Next
Select “Price Bar” and click Next
Select “NegClose” and click Next
Click on “Change Color” and select RED and click OK
Click Next
Click Finish
Click on “Create New Color Study”, again
Select “Price Plot” and click Next
Select “Price Bar” and click Next
Select “PosClose” and click Next
Click on “Change Color” and select GREEN and click OK
Click Next
Click Finish
Click on “Create New Color Study”
Select “Indicator” and select “VOLUME” then click Next
Select “Volume” and click Next
Select “NegVol” and click Next
Click on “Change Color” and select RED and click OK
Click Next
Click Finish
Click on “Create New Color Study”, again
Select “Indicator” and select “VOLUME” then click Next
Select “Volume” and click Next
Select “PosVol” and click Next
Click on “Change Color” and select GREEN and click OK
Click Next
Click Finish
Click on “Create New Color Study”
Select “Indicator” and select “PHASE” then click Next
Select “HISTOGRAM” and click Next
Select “PHASEDOWN” and click Next
Click on “Change Color” and select RED and click OK
Click Next
Click Finish
Click on “Create New Color Study”, again
Select “Indicator” and select “PHASE” then click Next
Select “HISTOGRAM” and click Next
Select “PHASEUP” and click Next
Click on “Change Color” and select GREEN and click OK
Click Next
Click Finish
Click OK to leave color studies
Feb 4, 2014 | Data Manager, Support
Reboot your computer. Once the computer has come back up, DO NOT try to open Data Manager. Open Windows Explorer, locate the c:\wintes32 folder. Locate the tdata folder. Delete the files master.adf and master.ndx. Once those files are deleted, open Data Manager, say Yes when asked to Rebuild.
This should clear up the problem.
Feb 4, 2014 | Support
– Click on Start, Run (or Start and in the search box), Type Regedit.
– Double click Regedit to start the Registry Editor.
– Double click H-Key Local Machine.
– Double click Software.
– Double click WoWxxxNode.
– Double click AIQ Systems.
– Double click TradingExpert 32.
– Highlight Registration and then press the Delete key on your keyboard.
Close the Windows Registry, right click the the TradingExpert main menu and choose Run As Administrator (or Properties, Compatibilty). The icons should auto-refresh.

 English