Jun 14, 2011 | Uncategorized
Here is the Aiq code based on Edgar Kraut’s article in this issue, “A Color-Based System For Short-Term Trading.” The code is also provided at the websites noted below. I coded the color indicators and three systems that use the indicators. Two of the three systems are discussed here.
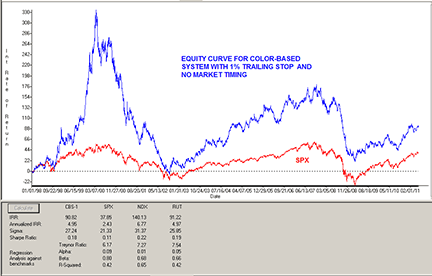
I ran backtests using the AIQ Portfolio Manager module from 1/1/1998 to 5/13/2011 trading the Nasdaq 100 list of stocks. In Figure 10, I show the test results of simulated trading using the system that was proposed in Kraut’s article for trading the SPY with the following capitalization parameters:
- Maximum positions per day = 3
- Maximum total positions allowed = 10
- Choose candidates using highest volume on the day of the signal
- Size each position at 10% of total account equity recomputed every day
Figure 10: AIQ SYSTEMS, Kraut’s Color-Based System. Here is a sample equity curve for Edgar Kraut’s system trading the NASDAQ 100 list of stocks compared to the S&P 500 index over the test period 1/1/98 to 5/13/11. This original system uses a 1% trailing stop as the only exit.SPX in red.
For the test period, the original system using the 1% trailing stop as the only exit showed an average annual return of 4.95% with a maximum drawdown of 78.52% on 10/9/2002.
Since the drawdown of 78.52% on the original system was more than most traders could tolerate, I added trend and market trend filters and also changed the buy rules and exit rules as follows:
Buy if there is a green or blue bar today and if yesterday there were six consecutive bars of orange or red color and the 200-bar simple moving average of both the stock and the S&P 500 index are higher than they were 10 bars ago.
Exit if there are four consecutive bars of orange or red.
All trades for both systems are executed at the next open after a trade signal occurs. A commission of $0.01 per share round-turn was used. The same capitalization parameters were used in testing both the modified system and the original system.
In Figure 11, I show the test results of simulated trading on the Nasdaq 100 list of stocks using this modified system. For the test period, this modified system showed an average annual return of 20.24% with a maximum drawdown of 31.55% on 5/25/2000.
Figure 11: AIQ SYSTEMS, MODIFIED System equity curve. Here is a sample equity curve for my modified system trading the NASDAQ 100 list of stocks over the test period 1/1/98 to 5/31/11 compared to the S&P 500 index.
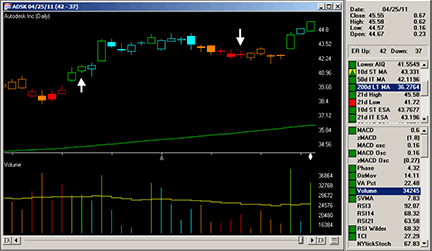
In Figure 12, I show the color-based indicators applied to both the price and volume on a chart of Adsk. The arrows on the chart also show a sample trade from the modified system.
Figure 12: AIQ SYSTEMS, MODIFIED System example. Shown here is a chart of ADSK with color studies and arrows showing sample trades from the modified system.
The code and Eds file can be downloaded from www.TradersEdgeSystems.com/traderstips.htm.
AIQ code:
! A COLOR-BASED SYSTEM FOR SHORT-TERM TRADING
! Author: Edgar Kraut, TASC July 2011
! Coded by: Richard Denning 5/14/11
! www.TradersEdgeSystems.com
! ABBREVIATIONS:
C is [close].
C10 is valresult(C,10).
V is [volume].
V10 is valresult(V,10).
! FOR COLOR BARS:
Green if C > C10 and V > V10.
Blue if C > C10 and V < V10.
Orange if C < C10 and V < V10.
Red if C < C10 and V > V10.
! FOR UDF IN REPORT COLUMN:
Signal is iff(Green,”Green”,iff(Blue,”Blue”,
iff(Orange,”Orange”,iff(Red,”Red”,””)))).
! TRADING SYSTEMS:
! ORIGINAL SYSTEM:
Buy if (Green or Blue) .
! Use built-in trailing stop set to 99 for exits
! FIRST MODIFICATION (NOT USED):
Buy2 if (Green or Blue)
and countof((Red or Orange),6,1)=6.
! SECOND MODIFICATION (FINAL SYSTEM):
SMA is simpleavg(C,200).
SPXsma is TickerUDF(“SPX”,SMA).
Buy3 if (Green or Blue)
and countof((Red or Orange),6,1)=6
and SMA > valresult(SMA,10)
and SPXsma > valresult(SPXsma,10).
Sell2 if countof((Red or Orange),4)=4.
Richard Denning for AIQ Systems
mailto:info@TradersEdgeSystems.com
Jun 14, 2011 | Uncategorized
Here is the Aiq code based on Edgar Kraut’s article in this issue, “A Color-Based System For Short-Term Trading.” The code is also provided at the websites noted below. I coded the color indicators and three systems that use the indicators. Two of the three systems are discussed here.
I ran backtests using the AIQ Portfolio Manager module from 1/1/1998 to 5/13/2011 trading the Nasdaq 100 list of stocks. In Figure 10, I show the test results of simulated trading using the system that was proposed in Kraut’s article for trading the SPY with the following capitalization parameters:
- Maximum positions per day = 3
- Maximum total positions allowed = 10
- Choose candidates using highest volume on the day of the signal
- Size each position at 10% of total account equity recomputed every day
Figure 10: AIQ SYSTEMS, Kraut’s Color-Based System. Here is a sample equity curve for Edgar Kraut’s system trading the NASDAQ 100 list of stocks compared to the S&P 500 index over the test period 1/1/98 to 5/13/11. This original system uses a 1% trailing stop as the only exit.SPX in red.
For the test period, the original system using the 1% trailing stop as the only exit showed an average annual return of 4.95% with a maximum drawdown of 78.52% on 10/9/2002.
Since the drawdown of 78.52% on the original system was more than most traders could tolerate, I added trend and market trend filters and also changed the buy rules and exit rules as follows:
Buy if there is a green or blue bar today and if yesterday there were six consecutive bars of orange or red color and the 200-bar simple moving average of both the stock and the S&P 500 index are higher than they were 10 bars ago.
Exit if there are four consecutive bars of orange or red.
All trades for both systems are executed at the next open after a trade signal occurs. A commission of $0.01 per share round-turn was used. The same capitalization parameters were used in testing both the modified system and the original system.
In Figure 11, I show the test results of simulated trading on the Nasdaq 100 list of stocks using this modified system. For the test period, this modified system showed an average annual return of 20.24% with a maximum drawdown of 31.55% on 5/25/2000.
Figure 11: AIQ SYSTEMS, MODIFIED System equity curve. Here is a sample equity curve for my modified system trading the NASDAQ 100 list of stocks over the test period 1/1/98 to 5/31/11 compared to the S&P 500 index.
In Figure 12, I show the color-based indicators applied to both the price and volume on a chart of Adsk. The arrows on the chart also show a sample trade from the modified system.
Figure 12: AIQ SYSTEMS, MODIFIED System example. Shown here is a chart of ADSK with color studies and arrows showing sample trades from the modified system.
The code and Eds file can be downloaded from www.TradersEdgeSystems.com/traderstips.htm.
AIQ code:
! A COLOR-BASED SYSTEM FOR SHORT-TERM TRADING
! Author: Edgar Kraut, TASC July 2011
! Coded by: Richard Denning 5/14/11
! www.TradersEdgeSystems.com
! ABBREVIATIONS:
C is [close].
C10 is valresult(C,10).
V is [volume].
V10 is valresult(V,10).
! FOR COLOR BARS:
Green if C > C10 and V > V10.
Blue if C > C10 and V < V10.
Orange if C < C10 and V < V10.
Red if C < C10 and V > V10.
! FOR UDF IN REPORT COLUMN:
Signal is iff(Green,”Green”,iff(Blue,”Blue”,
iff(Orange,”Orange”,iff(Red,”Red”,””)))).
! TRADING SYSTEMS:
! ORIGINAL SYSTEM:
Buy if (Green or Blue) .
! Use built-in trailing stop set to 99 for exits
! FIRST MODIFICATION (NOT USED):
Buy2 if (Green or Blue)
and countof((Red or Orange),6,1)=6.
! SECOND MODIFICATION (FINAL SYSTEM):
SMA is simpleavg(C,200).
SPXsma is TickerUDF(“SPX”,SMA).
Buy3 if (Green or Blue)
and countof((Red or Orange),6,1)=6
and SMA > valresult(SMA,10)
and SPXsma > valresult(SPXsma,10).
Sell2 if countof((Red or Orange),4)=4.
Richard Denning for AIQ Systems
mailto:info@TradersEdgeSystems.com
Jun 12, 2011 | Uncategorized
Steve Palmquist.
Author of ‘The Timely Trades Letter’. ‘How to Take Money from the Markets’, and Money-Making Candlestick Patterns.
During 20 years of active trading experience I have researched, tested, and analyzed a number of trading systems and techniques. Some have shown promising results, some do not. I add tools to my trading toolbox based on their effectiveness. Trading systems are not effective because Aunt Millie or uncle Bob told you about them, they are effective because they work. Most trading systems are affected by market conditions, volume patterns, and other factors. Successful traders know how these parameters affect trading results, so they know when to trade a particular pattern, and when to use another tool in their toolbox.
Making money in the stock market requires knowledge of what to trade, when to trade, and a variety of trading tools designed for different market conditions. Just as a carpenter will use several different tools when building a house, traders will use different tools to build their account. Using the same trading tool in all situations is like trying to build a house with just a hammer. Carpenters have tools designed for specific jobs, and so should traders. Testing and analyzing potential trading systems allows traders to select the ones most appropriate for the current market environment.
The successful trader has a tool box with a variety of trading tools for use in different market conditions. The trader, like the carpenter, must go beyond just acquiring the tools. Traders must understand which tool to use for a specific task, and have a clear understanding of how the tool works, and what can and cannot be done with it. I have extensively tested several trading systems, the results of this testing on specific trading trading tools are outlined in ‘How to Take Money from the Markets’, and Money-Making Candlestick Patterns. The testing process helps us understand how stocks usually behave after forming a specific pattern such as being outside the Bollinger Bands, showing strong distribution or accumulation, or pulling back or retracing during a trend. Understanding what a stock is most likely to do forms the beginning of a trading strategy. Trading without this information is taking unknown risks.
Jun 2, 2011 | Uncategorized
It so happens that the doji is able to teach much of candlestick theory. If an undecided market contemplates retracement or pauses a while to reconsider the trend upon which it has embarked, this of itself will demand no alteration in price. When the market tests various levels and yet returns to its original price the premise is even more securely made. Here it is found that the greater the extension of the shadows on either side of the real body of the doji, the more pronounced the market’s reassessment. That the market has tested vast levels to the upside or to the downside as well is of great relevance to the issue of price discovery. When it has rejected these extremes to return not to a new found level of value but its original opening price, it is not merely a coincidence but an indication that momentum has come to an abrupt halt. For swing traders the doji must be understood in all its forms, for it provides one of the clearest signals for entry into the market or exit thereof.
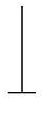
When the market has tested the downside thoroughly and shows a doji at the peak of the candlestick with a long shadow extending downward, the contention goes to market strength rather than weakness; it has convincingly rejected lower prices and recovered to close at its highs – at its open. Still, the doji is an indication of indecision and needs further confirmation before entering the market. However, while the fact that an upper range has not been pursued balances out any bullish optimism, it may well be that the downside has been preoccupying the market however, and so the Dragon Fly Doji depicted below is inherently a bullish signal. When it occurs after sustained retracement it suggests a reversal is imminent, and when after an upward trending market, the suggestion that the trend has played out its natural course and has come to an end is patent.
Dragon Fly Doji
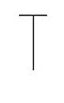
Similarly, the Gravestone Doji below mirrors the Dragon Fly already discussed. Here the market has given extensive airing to the upside and has yet concentrated price discovery upon not only its lows, but its opening price. That the downside has not been more thoroughly explored is valid, but hardly able to dilute the bearish signal exuded. When at the end of an uptrend it clearly indicates a reversal is likely; when at the bottom of the market – indecision is rife, but any short positions ought to be covered.
Gravestone Doji
May 26, 2011 | Uncategorized
Original article by Walid Khalil and David Steckler in Stocks & Commodities
AIQ Code by Richard Denning
The AIQ code for Walid Khalil and David Steckler’s article, “Entering The Price Zone”, is shown below. I coded both the Price Zone Oscillator (PZO) and Volume Zone Oscillator Indicator (VZO) (from the prior month’s article by the same authors) along with the system that uses the PZO or VZO indicator. There is an input at the top of the code called “usePZO”. When this input is set equal to “1” then the indicator and system use the PZO. If set to any other value, then the indicator and system use the VZO oscillator. I had to use my own interpretation of what the divergence sell/cover rules of their system mean since the exact code for this part of the system is not given in the article. Also note that the non-trending case is provided with this code but tests of the rule “BuyNoTrnd” showed that trading only when the market is trending was the better choice. As a result, my tests below were of only the trending portion of the system as I had done in last month’s tests.
I ran a back test using the Portfolio Manager module from 1/1/98 to 4/8/11 using the NASDAQ 100 list of stocks. In Figure 1, I show the test results of simulating trading the NASDAQ 100 list of stocks, using the following parameters for capitalization:
1) Maximum positions per day = 3
2) Maximum total positions allowed = 10
3) Choose candidates using ADX values in descending order
4) Size each position at 10% of total account equity recomputed every day
For the test period, the average annual return was 11.3% with a maximum drawdown of 67.7% on 02/07/03.
In last month’s issue, I ran a similar test using the VZO indicator and the results were slightly better than using the PZO indicator with this system.
The short side test was unsuccessful as the system lost all its capital during the early years of the test. These results are not shown in any figures. I tried adding an index trend filter but this did not save the short side from total loss.
Captions:
Figure 1 – PZO system equity curve trading longs only using the NASDAQ 100 list of stocks compared to the SPX index for the test period 1/1/98 to 4/8/11.
EDS Code for Entering the Price Zone:
EnterPriceZone.EDS
(right click and choose Save As)
May 25, 2011 | Uncategorized
Steve Palmquist.
Author of ‘The Timely Trades Letter’. ‘How to Take Money from the Markets’, and Money-Making Candlestick Patterns.
I got an interesting email from a potential trader who was concerned that trading might ‘take too much time’. Apparently the new bailout mentality in the country has people thinking they should be able to make a lot of money quickly with little investment in education, tools, or experience. Trading, like most other professions takes time to learn. It will take a couple of years, not a couple of weekends, to learn the process of trading. It takes time because traders need to see how things work in different market conditions, and it takes time for the market to cycle between these different conditions. On the other side, the actual trading process does not require one to be glued to a computer all day, it can generally be done in minutes. The trading systems I use are based on end of day data. They have been developed and tested by looking at daily patterns, not five minute charts. Since I trade the daily patterns, I do not need to see the five minute charts.
I run the scans, pick the setups, use market conditions to determine whether to focus on longs, shorts, or cash, and then implement the trading plan. It takes me less than thirty minutes to check the setups on the watch list if I do it manually, and less time if I have my broker text me alerts when a setup hits a price level of interest. It takes time to learn trading just like it takes time to learn to be a doctor, engineer, or electrician. Once the trading skills are learned, the actual time spent trading can be quite short.
Holding periods and profit taking should be based on current market conditions. Take profits quickly in trading range markets, and give positions more time to work in trending markets. In non trending markets holding periods are usually not more than a few days. In trending markets holding periods may be several weeks or months. In non-trending markets consider taking profits after the initial pop from the trigger. Look to exit as the stock approaches the Bollinger Band, a recent high, a trend line, or when the market approaches support/resistance.
In order to find out what the usual, or normal course of action is, I have extensively tested several trading systems, the results of this testing on specific trading trading tools are outlined in ‘How to Take Money from the Markets’, and Money-Making Candlestick Patterns. The testing process helps us understand how stocks usually behave after forming a specific pattern such as being outside the Bollinger Bands, showing strong distribution or accumulation, or pulling back or retracing during a trend. Understanding what a stock is most likely to do forms the beginning of a trading strategy.
May 19, 2011 | Uncategorized
Thank you for attending today’s webinar ‘How to identify signs of exhaustion in an up move’ is on Thursday May 19th, 4:30pm eastern.
If you missed the event or would like to review the session, the recording is now available
We will be scheduling a second event covering using the VIX and Volatility as an indicator of exhaustion in early June. We’ll keep you posted when the event details are available.
Presenter
Stephen Hill is CEO of AIQ Systems. For the past 15 years he has been involved in all aspects of AIQ Systems, from support and sales to programming and education. Steve is a frequent speaker at events in the U.S. and Europe, talking on subjects as diverse as Portfolio Simulation Techniques, Advanced Chart Pattern Analysis and Trading System Design.
May 15, 2011 | Uncategorized
Steve Palmquist.
Author of ‘The Timely Trades Letter’. ‘How to Take Money from the Markets’, and Money-Making Candlestick Patterns.
Successful traders examine the current market conditions to determine if they are bullish, bearish, or a trading range environment. Traders can determine which of the three modes the market is currently in by looking at a daily chart of the market action over the last year, using the 5X20 moving average filter, or through trend line analysis. I use each of these techniques for my own trading, and publish the analyses and trading setups in the Timely Trades Letter. After determining the current market environment, traders can select the tools from the their trading tool box that perform best in the current conditions. Having multiple trading tools that have been carefully tested and analyzed in each of the major market conditions is a key part of successful trading. If you trade the same tool all the time, or do not adapt to changing market conditions, you may get a lot of practice exercising stops.
Pullbacks are one of the bread and butter techniques of trading because they occur frequently and can be found in most market conditions. Most traders should have more than one pullback system in their trading tool box. There are interesting pullback systems based on the percentage of retracement, pullbacks to key moving averages, pullbacks for a specific number of days, and pullbacks with specific volume patterns. Specific pullback techniques and information on how they perform in different market conditions is covered in ‘How to Take Money from the Markets’. The book also shows specific techniques for adapting trading strategies and techniques to the current market conditions.In addition to adapting to the current market conditions by using the appropriate tools from the trading tool box there are several practical aspects of trading that traders need to master.
Never enter a position without having a plan for exiting the position. If you Do not know where to get out of a position you should not enter it in the first place. In swing trading time frames stocks often run to the next resistance or Support level and then stall. Stocks rarely remain outside the Bollinger bands for long, so when a position reaches the Bands it is often a good place to look at profit taking, especially in trading range environments. There is usually no need to rush in when the markets trend changes. Any trend worth trading does not require you to be in on the first day, by definition. Make sure that your position sizing is such that if all your current positions were stopped out that the total loss is something that is still comfortable. This happens from time to time, wishing it did not will not change it. Be prepared by using sensible position sizes.
May 10, 2011 | Uncategorized
FREE webinar Thursday May 19th, 4:30pm eastern
How do you know when the move up is over for a ticker? In this first of two FREE webinars, we’ll discuss several key signs that it’s all over including:
• Exhaustion Gap – how to identify it’s an exhaustion and not a runaway parabola.
• Rising Channel breakdown – you’ve ridden the channel riding out the pullbacks. We’ll cover the key elements that indicate this is not a pullback but a breakdown.
• Doji Candlestick – when it’s identified correctly it really means the move is over.
Sound interesting? Join me for this FREE webinar on ‘How to identify signs of exhaustion in an up move’
Thursday May 19th, 4:30pm eastern
Visit http://aiqsystems.com/webinarexhaustion.html to register.
Steve Hill
AIQ Systems
May 7, 2011 | Uncategorized
Steve Palmquist.
Author of ‘The Timely Trades Letter’. ‘How to Take Money from the Markets’, and Money-Making Candlestick Patterns.
Trading is about risk management. Traders learn how to manage risk by testing different trading strategies to see how they have performed in different market conditions. Testing trading strategies also helps to identify various volume and price patterns that may improve trading results in each of the three key market conditions. Volume patterns improve the statistics for many trading patterns. Strong volume and price patterns do not guarantee a result, nothing does, but they may improve the odds as demonstrated by the research presented in ‘How to Take Money From the Markets’. Using well researched price and volume patterns can be ways to manage risk. The research can also be helpful in determine which of several trading systems or tools may be the most appropriate for the current market conditions. One way to know what may or may not improve the results for a given technique is to understand how different price and volume parameters, along with different market conditions effect trading results. That is why I wrote ‘How to Take Money From the Markets’.
When the market is rocking I generally just enter strong setups without worrying much about the volume on the entry day. When the market is moving strongly then pullbacks, flags, and some of the other patterns I have tested generally mark pauses in the trend. If the pattern is generally a pause in the trend, then the odds are with me; and I do not need the confirmation provided by strong volume on the day of the trigger. When the market is more uncertain then I want to use additional tools to increase the odds of a favorable result, and I select the most appropriate tools based on the research presented in ‘How to Take Money From the Markets’.
How stocks and the market behave around the Bollinger Bands is very important to understand. Based on extensive testing I have learned to take profits in uncertain markets when my position becomes extended above the upper Bollinger Band. If you want a good lesson on risk management and why I exit positions that become extended above the upper Band take a look at the recent action in SLV. I did not get all the profit from the run up because the extension above the upper band had me out a week before the peak. However I still have my profits, and anyone holding last week took a thirty percent hit. I trade the charts and manage risk based on what I have learned from extensive testing.



 English