Jan 16, 2012 | Uncategorized
Steve Palmquist.
Author of ‘The Timely Trades Letter’.
‘How to Take Money from the Markets’,
and Money-Making Candlestick Patterns.
Analyzing trading patterns is vitally important to trading. Trading without understanding the statistics of a trading pattern is just taking unknown risks, and makes little sense. The trading patterns tested and analyzed in my first two books provide the beginnings of a trading toolbox, and the knowledge of when to use each tool. Without a clear understanding of how and when different trading patterns work, it’s easy to get caught up in fear, greed, group think, etc. However these emotional and non-data driven approaches often lead to losses. Traders need to be first and foremost focused on what the market is doing, and then selecting the most appropriate trading patterns, or remaining in cash, to address the current market conditions. Without previous testing and analysis of trading tools, and how they perform in differrent market conditions, traders are just randomly using tools that may or may not be appropriate for the current market.
It is also very important to have a clear exit strategy before entering any trade. If I don’t know where I want to exit a trade then I don’t take the trade in 1st place. In trading range markets most stocks tend to pop and drop, if they didn’t the market (which is the summation the large number of stocks ) would be trending. So a trading range environment tells us that stocks are not going to run very far, by definition. I use this information to drive my exit strategy which is more short term in a trading range market then it is a trending market as outlined below. In a trending market, individual stocks tend to pop and then move for a while. The market, the summation of a large number of stocks, is moving or trending because a lot of individual stocks are moving or trending. Once again observing the market conditions tells us how individual stocks are likely to behave, and that tells us how to manage our exit strategies.
Trading should be data driven, not based on emotion, whishful thinking, or hot tips from TV hosts. To be data driven one needs to test and analyze trading tools and find out what really works, and when each tool should be used. Traders must understand which tool to use for a specific task, and have a clear understanding of how the tool works, and what can and cannot be done with it. I have extensively tested several trading systems, the results of this testing on specific trading trading tools are outlined in ‘How to Take Money from the Markets’, and Money-Making Candlestick Patterns. The testing process helps us understand how stocks usually behave after forming a specific pattern such as being outside the Bollinger Bands, showing strong distribution or accumulation, or pulling back or retracing during a trend. Understanding what a stock is most likely to do forms the beginning of a trading strategy. Trading without this information is taking unknown risks.
Jan 12, 2012 | Uncategorized
Today’s webinar by Richard Muller, Reuters Equity Analyst, senior instructor at The Trading Prism, and long time AIQ TradingExpert Pro user has been recorded. Richard covered the Expert Ratings on the US markets before moving onto group/sector rotation using AIQ Reports. His stock selection process was geared toward possible options trades. You can view this video at
http://aiqsystems.com/prismjan12.html
Jan 10, 2012 | Uncategorized
Join Richard Muller, for a live webinar on the current market and a look at some interesting stocks setting up technically.
Wednesday 11th January at 7.00pm London time, 2.00 pm eastern
Richard’s investment trading career started out in emerging markets in 1995, up to 2000, where he did extensive equity fundamental analysis, as well as macro market analysis while based in South Africa.
Over the last 10 years, while based in the UK, he has built up extensive global equity research and macro market analysis as both a buy side equity analyst, as well as a global equities proprietary trader. Previous positions included sell side equity research analyst with JP Morgan Chase and HSBC. Buy side analyst with Reabourne, part of Close Brothers, and as proprietary trader with Van Der Moolen Securities ltd. Richard also held a position as CEO of ETI Investment, an investment management firm.
Currently Richard Muller is a global equities analyst with Thomson Reuters, where he delivers investment ideas on the Reuters Insider financial TV channel.
Richard qualified as a Chartered Management Accountant, and holds a Masters of Science degree in investments, MSc ISIB.
Richard’s Reuters TV shows offer detailed analysis of the equity markets. Richard is a long time user of AIQ TradingExpert Pro.
Dec 12, 2011 | Uncategorized
The AIQ code for the reverse MACD functions and indicators described in Johnny Dough’s article in the Decmber issue of Stocks & Commodities, “Reversing MACD,” is provided at the following website: www.TradersEdgeSystems.com/traderstips.htm, and is also shown below.
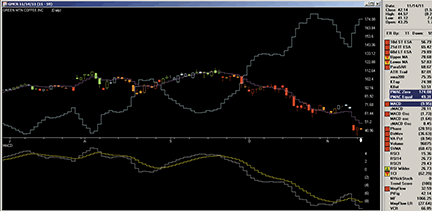
In the figure blow, I show a chart of Green Mountain Coffee Inc. with the two PMAC indicators and the MACD indicators. The cyan line is the PMACzero, which is the price tomorrow that would have to be attained for the MACD to equal zero. This indicator has wide swings because sometimes a big move in price is needed to bring the MACD back to zero. The purple line shows the PMACeq indicator, which shows tomorrow’s price that would make MACD the same as it was today. It stays close to the current price. The lower panel shows the MACD (white) and the MACD signal (yellow) indicators.
AIQ SYSTEMS, REVERSING MACD. Here is an example of the PMACzero (cyan) and PMACeq (purple) indicators on a chart of Green Mountain Coffee Inc. with MACD (white) and MACD signal line (yellow) indicators (lower panel).
!REVERSING MACD
!Author: Johnny Dough, TASC January 2012
!Coded by: Richard Denning 11/9/2011
!www.TradersEdgeSystems.com
!ABBREVIATIONS:
C is [close].
H is [high].
L is [low].
O is [open].
!INPUTS:
mfast is 12.
mslow is 26.
msig is 9.
!UDFs:
emaFast is expavg(C,mfast).
emaSlow is expavg(C,mslow).
MACD is emaFast – emaSlow.
sigMACD is expavg(MACD,msig).
len_X is mfast.
len_Y is mslow.
lvl is sigMACD.
alphaX is 2 / (1 + len_X).
alphaY is 2 / (1 + len_Y).
!PLOT THE FOLLOWING AS SINGLE LINE INDICATOR ON PRICE CHART:
PMACDeq is (expavg(C,len_X)*alphaX
-expavg(C,len_Y)*alphaY)/(alphaX-alphaY).
one_alphaX is 1 – alphaX.
one_alphaY is 1 – alphaY.
PMACDlvl is (lvl+expavg(C,len_Y)*one_alphaY
– expavg(C,len_X)*one_alphaX)/(alphaX-alphaY).
!PLOT THE FOLLOWING AS SINGLE LINE INDICATOR ON UPPER CHART:
PMACDzero is (0+expavg(C,len_Y)*one_alphaY
– expavg(C,len_X)*one_alphaX)/(alphaX-alphaY).
Nov 25, 2011 | Uncategorized
AIQ Education Holiday Sale
20% off your entire order on selected products
through December 14, 2011
Use coupon code holiday2011 when you checkout
Products include:
When Dale spoke to the attendees, everyone’s full undivided attention was set on him. He revealed his system that utilizes the power of the MACD (Moving Average Convergence Divergence) indicator, which is the only indicator he uses and swears by because of its astounding results with less risk. As he cuts right to the chase, he laid out the charts and let the simple rules demonstrate how it works and what it is capable of doing for the traders in the room……more
|
Long-term trading success is achieved using strategies that provide traders with an edge. But how can you prove that a system will show winning trades more often than random chance? You have to put it to the test. Don’t make costly mistakes by following the latest trading system blindly. Let Steve’s experience and expertise work for you. In this DVD course, he will not only provide you with six new powerful trading strategies, but he will show you exactly how to use each one to maximize profits……more
 Data that took Steve Palmquist years to compile and interpret is now at your fingertips. In this breakthrough guidebook, Palmquist reveals the most effective candlestick patterns and indepth information on back testing for optimal success.
Thorough and highly organized, this book teaches you to exploit every move the market makes with cutting-edge chart-reading techniques…….more
Nov 25, 2011 | Uncategorized
Basic economics dictates the premise of supply and demand and their ramifications on price. This theory holds that when demand exceeds supply price will appreciate, and when supply overshadows demand asset prices will fall. Indeed this holds true when markets rise and fall as it reflects the urgency of one side of the market to trade as opposed to the other. Yet every trade has a counter party; a buyer and a seller. On the face of it, this clearly indicates that demand and supply are equal, yet that price is rarely static reports to a further dynamic lending itself to momentum, inertia and urgency.
Markets are able to fluctuate somewhat freely on light volume as prices are pushed around by one or two big orders on a quiet trading day. Yet when trading volumes show a significant increase from the norm, this indicates substantial market interest. Here, buyers and sellers of varying points of view are increasingly interested in divesting each other of their respective positions.
While 80% of all trading activity has been found to be stop loss oriented, this alarming fact points to the variety of motivations that market participants adopt to investment decisions. Some are long term some short term; some are taking profits, some losses. Amid the confusion, one thing can be certain. When trading volume experiences a sharp increase – a dramatic market shift is imminent as the price has motivated substantial participants to become involved in decision making. At the end of a prevailing trend, volume will increase markedly, and so the market confirms this by participation. Rarely would this occur mid-trend as by definition a trend needs urgency of either supply or demand to outweigh one the in order to maintain its course.
Proponents of other indications such as technical analysis’ support and resistance, momentum’s MACD index, and mathematics’ Fibonacci numbers will all seek confirmation with an increase in volume prior to extending a signal. Primarily as the market needs to be supporting or rejecting a certain price, the absence of volume can hardly suggest that is the case. Indeed dwindling volumes are more an indication that the trend has met a natural end and that a retracement is imminent. A retraction in trading volume indicates that momentum is slowing and will find much profit taking entering the market, which will itself perpetuate movement back to true value.
In this sense, volume is rarely an indicator applied in isolation and is keenly attuned to other indicators and in particular, momentum. Still volume must be adjudged with relative comparison as some markets have typical volumes that would astound others. Volume ought never to be ignored as it indicates the bastion of trading activity – participation.
Nov 20, 2011 | Uncategorized
Steve Palmquist.
Author of ‘The Timely Trades Letter’.
‘How to Take Money from the Markets’, and
Money-Making Candlestick Patterns.
I went to the Traders Expo in Las Vegas last week. While walking the floor of the show and talking to traders, I was amazed at the number of people who were looking for a new trading technique because the one they were using was ‘not producing results’ during the last few weeks. There were a lot of slick presentations on trading, but few contained any real data indicating how the system actually performed, or how the results varied by market condition. Trading a tool based on just a few examples is a good way to drain an account. Most of these people only had one trading tool, either focused on stocks or ETFs, and did not trade both. They had no idea how their trading tool performed in different market conditions. They had no idea of how to adapt to the market conditions instead of complaining about them.
Trading the same tool constantly in all market conditions is a good way to drain an account. Moving blindly from one tool to another is also a good way to drain an account. Since stock and ETF trades often work in different timeframes; I have found that trading both is an advantage to me, and lets me participate in both short term and intermediate term movements. Understanding the current market conditions and having that information drive the selection of trading tools, number of positions traded, and position sizing, is one of the keys to success. It takes some time and effort to learn this. The ‘traders’ that are looking for a simple indicator or magic tool that will lead them to riches are asking for trouble.
There are no magic tools. If there were tools that required no effort to learn, and always worked, then everyone would be rich. Trading, like other professions, requires some time, effort, and expense, in order to develop the skills. None of the people complaining about the recent market environment had used that information to adjust their trading styles. In my case, I have been standing aside for a couple weeks as the market has shown unusual volatility in a tight trading range. Both of those conditions are caution signs, and together indicate it is best to sit tight and focus on protecting previous profits until the market picks a direction; which it will when it is ready. None of the people complaining about the market environment and the results of their trading were sitting tight (as the recent conditions called for). They felt that since they were traders they should be trading. When I suggested they should be focused on generating profits, not trades, and the recent environment had the odds stacked against them they were very quiet except for a couple that argued they had to be trading in order to have the opportunity to make profits. I quoted a Kenny Rogers song and told them that successful traders need to ‘know when to hold them and know when to fold them’. Sometimes the best, and most profitable, strategy is to stand aside for a week or so and let the market sort itself out. Traders need to have studied their trading tools and market conditions to know which tool is most likely to be appropriate for the current market conditions.
Trading should be data driven, not based on emotion, whishful thinking, or hot tips from TV hosts. To be data driven one needs to test and analyze trading tools and find out what really works, and when each tool should be used. Traders must understand which tool to use for a specific task, and have a clear understanding of how the tool works, and what can and cannot be done with it. I have extensively tested several trading systems, the results of this testing on specific trading trading tools are outlined in ‘How to Take Money from the Markets’, and Money-Making Candlestick Patterns. The testing process helps us understand how stocks usually behave after forming a specific pattern such as being outside the Bollinger Bands, showing strong distribution or accumulation, or pulling back or retracing during a trend. Understanding what a stock is most likely to do forms the beginning of a trading strategy. Trading without this information is taking unknown risks.
Nov 15, 2011 | Uncategorized
The AIQ code for Sylvain Vervoort’s put/call ratio indicator — named the IFTStoch indicator — and the related system from his article in the November issue of Stocks & Commodities, “Applying The Put/Call Ratio Indicator,” is provided at the website noted at the end of this writeup.
The code has been modified from the author’s formulas, which used weighted averaging. That type of averaging is not offered in AIQ as a built-in function and had to be coded long style; the result was very inefficient code that ran too slowly to be of any use. So I modified the formulas by substituting exponential averaging for the weighted averaging. The code now runs fast enough to be useful, and the indicators can be plotted without hanging up the processor.
I believe that the modified code can produce similar results. Although the values are not the same as the author’s values when using the same parameters, the resulting shapes of the indicators are similar.
On my website, I have a “PCratio.dta” data file that can be downloaded and saved into the “C:wintes32tdata” folder. Once the file is saved, go to the Data Manager module and run the utility “Rebuild Master Ticker List” to complete the data file installation process.
Using the system from Vervoort’s article called the SVE_Stoch_IFT, I ran a test on the NASDAQ 100 list of stocks using the Portfolio Manager module. The following capitalization settings were used:
- Maximum of 10 open positions
- Size each position at 10% of mark-to-market total capital
- Take no more than three new positions per day
- Compute the mark-to-market capital each day
- Choose signals based on the IFTStoch indicator for ranking in descending order for longs.
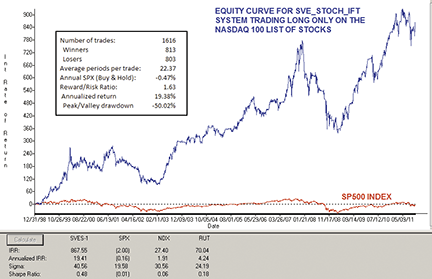
In Figure 6, I show the equity curve for long-only trading on the NASDAQ 100 list of stocks. The return averaged 19% per year with a maximum drawdown of 50% on March 9, 2009.
The short side, when tested separately from the longs, lost 91% of the initial capital by January 7, 2004, and then ceased to trade due to limited capital. The results of the short-side test are not shown.
I did not attempt to filter the trades using the put/call ratio indicators, since the author did not supply specific code for this purpose.
—Richard Denning
info@TradersEdgeSystems.comThis e-mail address is being protected from spambots. You need JavaScript enabled to view it. for AIQ Systems
Oct 27, 2011 | Uncategorized
Tech bulletin – 10/27/2011
Windows OS automatic update causing corrupted registration
An update from Microsoft may casue your Trading Expert Pro to receive a ‘corrupted registration’ message. To resolve this issue follow these instructions
– Click on Start, Run (or start and in the search box of) and Type Regedit.
– Double click Regedit to start the Registry Editor.
– Double click H-Key Local Machine.
– Double click Software.
– Double click WoWxxxNode.
– Double click AIQ Systems.
– Double click TradingExpert 32.
– Highlight Registration and then press the Delete key on your keyboard.
Close the Windows Registry, open the TradingExpert main menu. The icons should auto-refresh.
If you are not a myTrack customer, give Barbara a call at 800-332-2999 to get a new key, or click on Applications, Registration and email us the Registration number.
Oct 7, 2011 | Uncategorized
By Jay Kaeppel
No single indicator will accurately forecast or coincide with every market top or bottom. Here, two indicators have been combined to form one indicator that can increase your chances of identifying buy or sell points.
As a student of the market, I have crunched a few numbers over the years. At the same time I have tried, and cautioned others also, to avoid the temptation to divide one number by another or multiply one number by another simply because we can.
Not every calculation involving market indicators enjoys any real purpose. In addition, many indicators react in a manner similar to other indicators. Almost all overbought/oversold indicators tend to get more oversold as the market declines and more overbought as the market rallies. So stringing together more than a handful of similar indicators does not necessarily provide any additional benefit.
The AIQ EDS code for Jay Kaeppel’s Jkhl indicator discussed in his article in this issue, “The JK HiLo Index,” can be downloaded from www.TradersEdgeSystems.com/traderstips.htm.

AIQ SYSTEMS, THE JK HILO INDEX. This chart shows the JKHL indicator on a chart of the S&P 500 index together with a 200-bar moving average.
! THE JK HILO INDEX
! Author: Jay Kaeppel, TASC October 2011
! Coded by: Richard Denning 8/12/2011
! www.TradersEdgeSystems.com
! HIGH-LOW INDICATORS:
! JKlogic:
NewH is TickerUDF(“OCEXCH”,[New Highs]).
NewL is TickerUDF(“OCEXCH”,[New Lows]).
Adv is TickerUDF(“OCEXCH”,[Adv Issues]).
Dec is TickerUDF(“OCEXCH”,[Dec Issues]).
Unch is TickerUDF(“OCEXCH”,[Unch Issues]).
Tot is Adv + Dec + Unch.
PctNH is (NewH / Tot) * 100.
PctNL is (NewL / Tot) * 100.
HLidx is min(PctNH,PctNL).
avgHLidx is simpleavg(HLidx,10).
! JK VERSION OF HIGH LOW LOGIC INDICATOR:
JKlogic is iff(avgHLidx > 2.15 or avgHLidx < 0.40,avgHLidx,1).
! JK NEW HIGH PERCENT:
JKnH is simpleavg(NewH / (NewH + NewL),10).
! COMBINED TWO JK INDICATORS:
!Plot as single line with upper 90 lower 20 support
JKHL is JKlogic * JKnH * 100.
—Richard Denning
info@TradersEdgeSystems.comThis e-mail address is being protected from spambots. You need JavaScript enabled to view it.
for AIQ Systems



 English