Note that I did not attempt to replicate the SwamiCharts as displayed in Ehlers & Way’s article mainly because I am not a discretionary trader but rather focus on mechanical systems. I wanted to take the concept of multiple parameter sets for an indicator and see how this concept could be used in a trading system.
I decided to try a long-term trend-following system trading the NASDAQ 100 list of stocks using moving averages of various lengths. I created an indicator that uses five simple moving average lengths (10, 20, 50, 100, 200). If the close is above the moving average, then it gets a value of +1; otherwise, it gets a value of -1. I then simply sum the five values from the different lengths to create the SMA_SWAMI indicator. I then created a system with the indicator by entering long when the indicator is greater than or equal to 4 and exit when it drops to less than -4. I didn’t test the short side of the system, only the buy side. The code to test the short side is provided but was not tested.
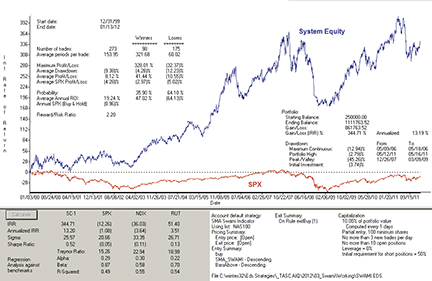
FIGURE 6: AIQ SYSTEMS, SMA_SWAMI SYSTEM.
Here is an equity curve for the theoretical SMA_SWAMI system compared
to the S&P 500 with the test statistics for the SMA_SWAMI system
trading the NASDAQ 100 list of stocks from 1/3/2000 to 1/13/2012.
In Figure 6, I show the equity curve and test statistics for the SMA_SWAMI system trading the NASDAQ 100 list of stocks from 1/3/2000 to 1/13/2012. The system averaged 13% compounded annual return with a maximum drawdown of 45% during the 2007–09 bear market.
This system is for illustrative purposes only and is not meant to be a finished system for live trading.
!INTRODUCING SWAMI CHARTS !Authors: John Ehlers and Ric Way, TASC March 2012 !System author: Richard Denning 1/15/2012 !Coded by: Richard Denning 1/15/2012 !www.TradersEdgeSystems.com
!INPUTS: buyLvl is 4. exitBuyLvl is -4. sellLvl is -3. exitSellLvl is 0.
C is [close]. sma10 is simpleavg(C,10). sma20 is simpleavg(C,20). sma50 is simpleavg(C,50). sma100 is simpleavg(C,100). sma200 is simpleavg(C,200).
sig10 is iff(C > sma10,1,-1). sig20 is iff(C > sma20,1,-1). sig50 is iff(C > sma50,1,-1). sig100 is iff(C > sma100,1,-1). sig200 is iff(C > sma200,1,-1).
buy if SMA_SWAMI >= buyLvl and valrule(SMA_SWAMI < buyLvl,1). exitBuy if SMA_SWAMI < exitBuyLvl. sell if SMA_SWAMI <= sellLvl. exitSell if SMA_SWAMI > exitSellLvl.
—Richard Denning info@TradersEdgeSystems.comThis email address is being protected from spambots. You need JavaScript enabled to view it. for AIQ Systems
We’re trying to make things simpler! AIQ has now launched client portal pages with commonly requested items and information specifically orientated to your service with AIQ. These are accessible from the AIQ Home page from the Client Portal section on the left.
For example, TradingExpert Pro lease clients can
Upgrade an existing TradingExpert Pro installation
Download a full version of TradingExpert Pro for reinstalling
Add Chart Pattern Recognition service
Order an historical data CD package
Explore additional useful links
We have also combined all AIQ educational products, software products, data products and add on products into a simplified store front.
I frequently get emails from new traders wondering how to get the time to ‘watch their trades all day’. This is generally not necessary for swing trading, and in fact may lead to over trading and poor decision making. All of the testing I have done is based on end of day data, with entries being done at the open the day following the pattern trigger, and a number of trading systems show interesting results using this approach. The patterns discussed in my two books were tested on end of day data, and did not require any monitoring of positions during the day. I am trading patterns, not hunches or the latest ‘expert opinion’ on CNBC. I used to have CNBC on most of the time, but I found my trading improved when I turned it off and focused on the trading patterns and the market conditions rather than ‘news’, press releases, ‘experts’, and so on.
Each pattern either works or it doesn’t. The idea is to find patterns with a statistical edge, then trade them in appropriate market conditions using appropriate money management techniques. There is no way to know if any particular trade will be profitable, there are no magic indicators or secret techniques that tell you if a specific trade will work. Each trade has a certain probability of working, some will work and some will not. Trading is a statistical business where I want to know the odds of a particular pattern working in a particular market condition, and then use this information to be positioned to profit if the market or the stock follows the most likely path. To do otherwise makes little sense.
Trading should be data driven, not based on emotion, whishful thinking, or hot tips from TV hosts. To be data driven one needs to test and analyze trading tools and find out what really works, and when each tool should be used. Traders must understand which tool to use for a specific task, and have a clear understanding of how the tool works, and what can and cannot be done with it. I have extensively tested several trading systems, the results of this testing on specific trading trading tools are outlined in ‘How to Take Money from the Markets’, and Money-Making Candlestick Patterns. The testing process helps us understand how stocks usually behave after forming a specific pattern such as being outside the Bollinger Bands, showing strong distribution or accumulation, or pulling back or retracing during a trend. Understanding what a stock is most likely to do forms the beginning of a trading strategy. Trading without this information is taking unknown risks.
When the market breaks out of a basing pattern, as it did last week, it makes it easier for strong stocks to run. When the market is basing, most stocks tend to run a bit, then reverse. When the market breaks out more stocks tend to move above their trigger points and they tend to run longer. I always want to be adapting my position sizing, and the number of trading positions I am using, to the current market conditions. When the market is in a basing pattern I use smaller than normal position sizes and trade fewer positions. After the market breaks out of a base I am willing to use larger position sizes and trade more of them. Using smaller position sizes during more risky market environments helps preserve previous profits.
We saw nice moves in a number of the swing trading setups from the last Letter including AAPL, AAP, TSCO, ULTA, PVX, VOXX, and AWK. Most of the setups rose above their trigger points and kept moving up into their next resistance areas, thus providing nice profitable moves. I followed the standard prioritization process outlined in previous Letters for selecting the trades I wanted to enter. I took profits on trades as they approached their upper Bollinger Band. The market is moving and so are our setups, nice week.
As noted in previous Letters one of the the sweet spots for holding swing trades is three to five days. A number of systems show interesting results just using a time stop and exiting after three to five days. The rule I use is to have a good reason to hold after three days. When the market is bullish there are often good reasons to hold such as more room to run to the next resistance area, not very extended above the fifty day moving average, moving on strong volume, etc. If its is not clear that there is a good reason to hold, then I happily take profits and move on to the next pattern that is breaking out and just starting its run. I am not trying to hold on for the last dime in every position, there is no way to do that consistently. I am trading patterns, not stocks. When a setup moves and becomes extended I would rather ride a fresh horse than one that has been running for awhile and may be tired.
AAPL moved above its trigger point during Monday’s session and ran up every day last week, gaining thirty five points. I picked up the AAPL trade on Monday and let it run during the sessions on Monday, Tuesday, and Wednesday. On Thursday AAPL moved above the upper Bollinger Band which is generally a sell signal. The reason for this can be found in the research outlined in ‘How to Take Money From the Markets’. My research indicates that one can develop an interesting system for shorting strong moves above the upper Bollinger Band. This also implies that if I am long and a position moves above the upper Band I should consider taking profits. I have extensively tested several trading systems, the results of this testing on specific trading trading tools are outlined in ‘How to Take Money from the Markets’, and Money-Making Candlestick Patterns. The testing process helps us understand how stocks usually behave after forming a specific pattern such as being outside the Bollinger Bands, showing strong distribution or accumulation, or pulling back or retracing during a trend.
A number of traders use chart indicators to determine when to enter and exit trades. Most charting programs include dozens of different indicators that can be displayed on the charts. Popular indicators such as the Stochastic, and MACD, are frequently discussed when traders get together. I have listened to a number of these discussions, the interesting thing is that people typically explain why they use a particular indicator by citing an number of examples of when it has worked for them. When they do, another trader will typically say something like, ‘well it did not work for me, so I use the XYZ indicator which is much more reliable’. When I ask the second trader why his XYZ indicator is more reliable, the explanation usually involves a few more examples of good trades.
Examples do not prove anything. It is possible to flip a coin and have it come up heads five times in a row. Few traders would observe this and then think that when you flip a coin it always comes up heads. Yet for some reason people will read an article about an indicator that shows four or five examples of good trades it produced, and then they will go and risk their money trading the technique. They typically trade the new technique until it produces several losses in a row, and then they start looking for another article that describes a ‘better’ technique, and the process repeats itself in an endless search for a better trading system.
Adopting a trading technique because it was recommended by someone, or written about in an article that showed a few working examples, is a high risk endeavor. Trading is a statistical business. Traders need to understand how a potential system has performed over hundreds, or thousands, of trades. If you flip a coin three times there is a one in eight chance of it coming up heads three times in a row. If you observed this example and drew conclusions about the probability of heads coming up you would be wrong, just like seeing three examples of when an indicator produced favorable results could also be wrong.
Trading should be data driven, not based on emotion, whishful thinking, or hot tips from TV hosts. To be data driven one needs to test and analyze trading tools and find out what really works, and when each tool should be used. Traders must understand which tool to use for a specific task, and have a clear understanding of how the tool works, and what can and cannot be done with it. I have extensively tested several trading systems, the results of this testing on specific trading trading tools are outlined in ‘How to Take Money from the Markets’, and Money-Making Candlestick Patterns. The testing process helps us understand how stocks usually behave after forming a specific pattern such as being outside the Bollinger Bands, showing strong distribution or accumulation, or pulling back or retracing during a trend. Understanding what a stock is most likely to do forms the beginning of a trading strategy. Trading without this information is taking unknown risks.
In this live hour long recording from a live seminar, Steve Hil, President of AIQ Systems explains how to tell when an up move in a stock is over and it’s time to exit poisitions or go short. Steve discusses exhaustion gaps, rising channel breakdowns, doji candlestick, volatility fade, volume exhaustion and more
In this live hour long recording from a live seminar, Steve Hil, President of AIQ Systems explains how to tell when an up move in a stock is over and it’s time to exit poisitions or go short. Steve discusses exhaustion gaps, rising channel breakdowns, doji candlestick, volatility fade, volume exhaustion and more
Making good trading decisions involves finding indicators that cut through the market noise. But how do you do it without collapsing under the weight of information?
Chart analysis is a multidimensional affair; no single indicator can tell the entire story. After spending years cluttering my screen with multiple indicators, I discovered that more is not necessarily better because they sometimes present conflicting information. Often, it takes longer to analyze the information needed to make decisions.
The goal is to integrate the knowledge that indicators provide in order to evaluate the situation that leads to making good trading decisions. That means each trader needs to find those indicators that cut through the market news (and noise) in a way that makes most sense to him or her without collapsing from information overload. Here’s a method I have found useful.
The first step is to determine the categories from which to draw the indicators. For me, that includes trend, momentum, volatility, and volume (TMV). These present a multi-dimensional view of price behavior to supply a more complete picture…..excerpt of Barbara Star’s article in Stocks & Commodities, “Trade Breakouts And Retracements With TMV,”
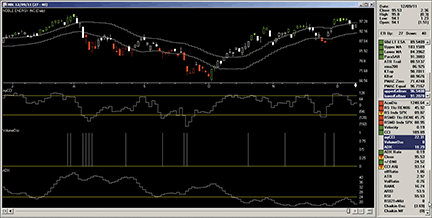
AIQ SYSTEMS, KELTNER CHANNELS, CCI, AND COLOR-CODED PRICE BARS. Here’s a sample chart of Noble Energy with the TMV indicators.
!TRADE BREAKOUTS AND RETRACEMENTS WITH TMV !Author: Barbara Star,PhD, TASC February 2012 !Coded by: Richard Denning 12/9/2011 !www.TradersEdgeSystems.com
!CODING ABREVIATIONS: C is [close]. C1 is valresult(C,1). O is [open]. H is [high]. L is [low]. H1 is valresult(H,1). L1 is valresult(L,1). V is [volume].
!KELTNER CHANNEL !INPUT: keltLen is 20. !KELTNER CHANNEL UDFs: typ is (H+L+C)/3. rangeAvg is simpleavg(H-L,keltLen). !Plot the following three functions on price chart !as three separte indicators: midKelt is simpleavg(typ,keltLen). upperKelt is midKelt + rangeAvg. lowerKelt is midKelt – rangeAvg.
!ADX !INPUT: WilderLen is 10. !NOTE: Wilder to expontential averaging the formula is: !Wilder length * 2 -1 = exponential averaging length
!USED FOR DMI, ATR, ADX, ADX RATE avgLen is WilderLen * 2 – 1.
!AVERAGE TRUE RANGE: TR is Max(H-L,max(abs(C1-L),abs(C1-H))). ATR is expAvg(TR,avgLen). ATRpct is expavg(TR / C,avgLen) * 100.
!+DM -DM CODE: rhigh is (H-H1). rlow is (L1-L). DMplus is iff(rhigh > 0 and rhigh > rlow, rhigh, 0). DMminus is iff(rlow > 0 and rlow >= rhigh, rlow, 0). AvgPlusDM is expAvg(DMplus,avgLen). AvgMinusDM is expavg(DMminus,avgLen).
!DMI CODE: PlusDMI is (AvgPlusDM/ATR)*100. !PLOT (2 lines) MinusDMI is AvgMinusDM/ATR*100. !PLOT (2 lines). DirMov is PlusDMI – MinusDMI. DirMovAIQ is [dirMov].
!ADX INDICATOR as defined by Wells Wilder !PLOT DIdiff as historigram is same as DirMov (AIQ built in indicator): DIdiff is PlusDMI-MinusDMI. ZERO if PlusDMI = 0 and MinusDMI =0. DIsum is PlusDMI+MinusDMI. DX is iff(ZERO,100,abs(DIdiff)/DIsum*100). !PLOT ADX as single line indicator with support at 24: ADX is expavg(DX,avgLen).
!VOLUME OSCILLATOR: !INPUTS: volLen1 is 1. volLen2 is 20. pctChgLvl is 50. !VOLUME OSCILLATOR UDFs: volAvg1 is simpleavg(V,volLen1). volAvg2 is simpleavg(V,volLen2). pctChgV is (volAvg1 / volAvg2 -1) * 100. volOsc is iff(abs(pctChgV)>pctChgLvl,1,0). !PLOT
!CCI INDICATOR: !INPUTS: cciLen is 13. !CCI UDFs: typAvg is simpleavg(typ,cciLen). absdiff is abs(typ-typAvg). sumD is sum(absdiff,cciLen)/ cciLen. CCI is (typ – typAvg) / (0.015 * sumD). !PLOT WITH +100 -100 LINES
!COLOR BAR RULES: !INPUT: trndLen is 8. Green if ADX > valresult(ADX,1) and C > simpleavg(C,trndLen). Red if ADX > valresult(ADX,1) and C < simpleavg(C,trndLen).
—Richard Denning info@TradersEdgeSystems.comThis e-mail address is being protected from spambots. You need JavaScript enabled to view it. for AIQ Systems



 English