Mar 30, 2016 | group sector rotation, Reports, swing trading, trading strategies
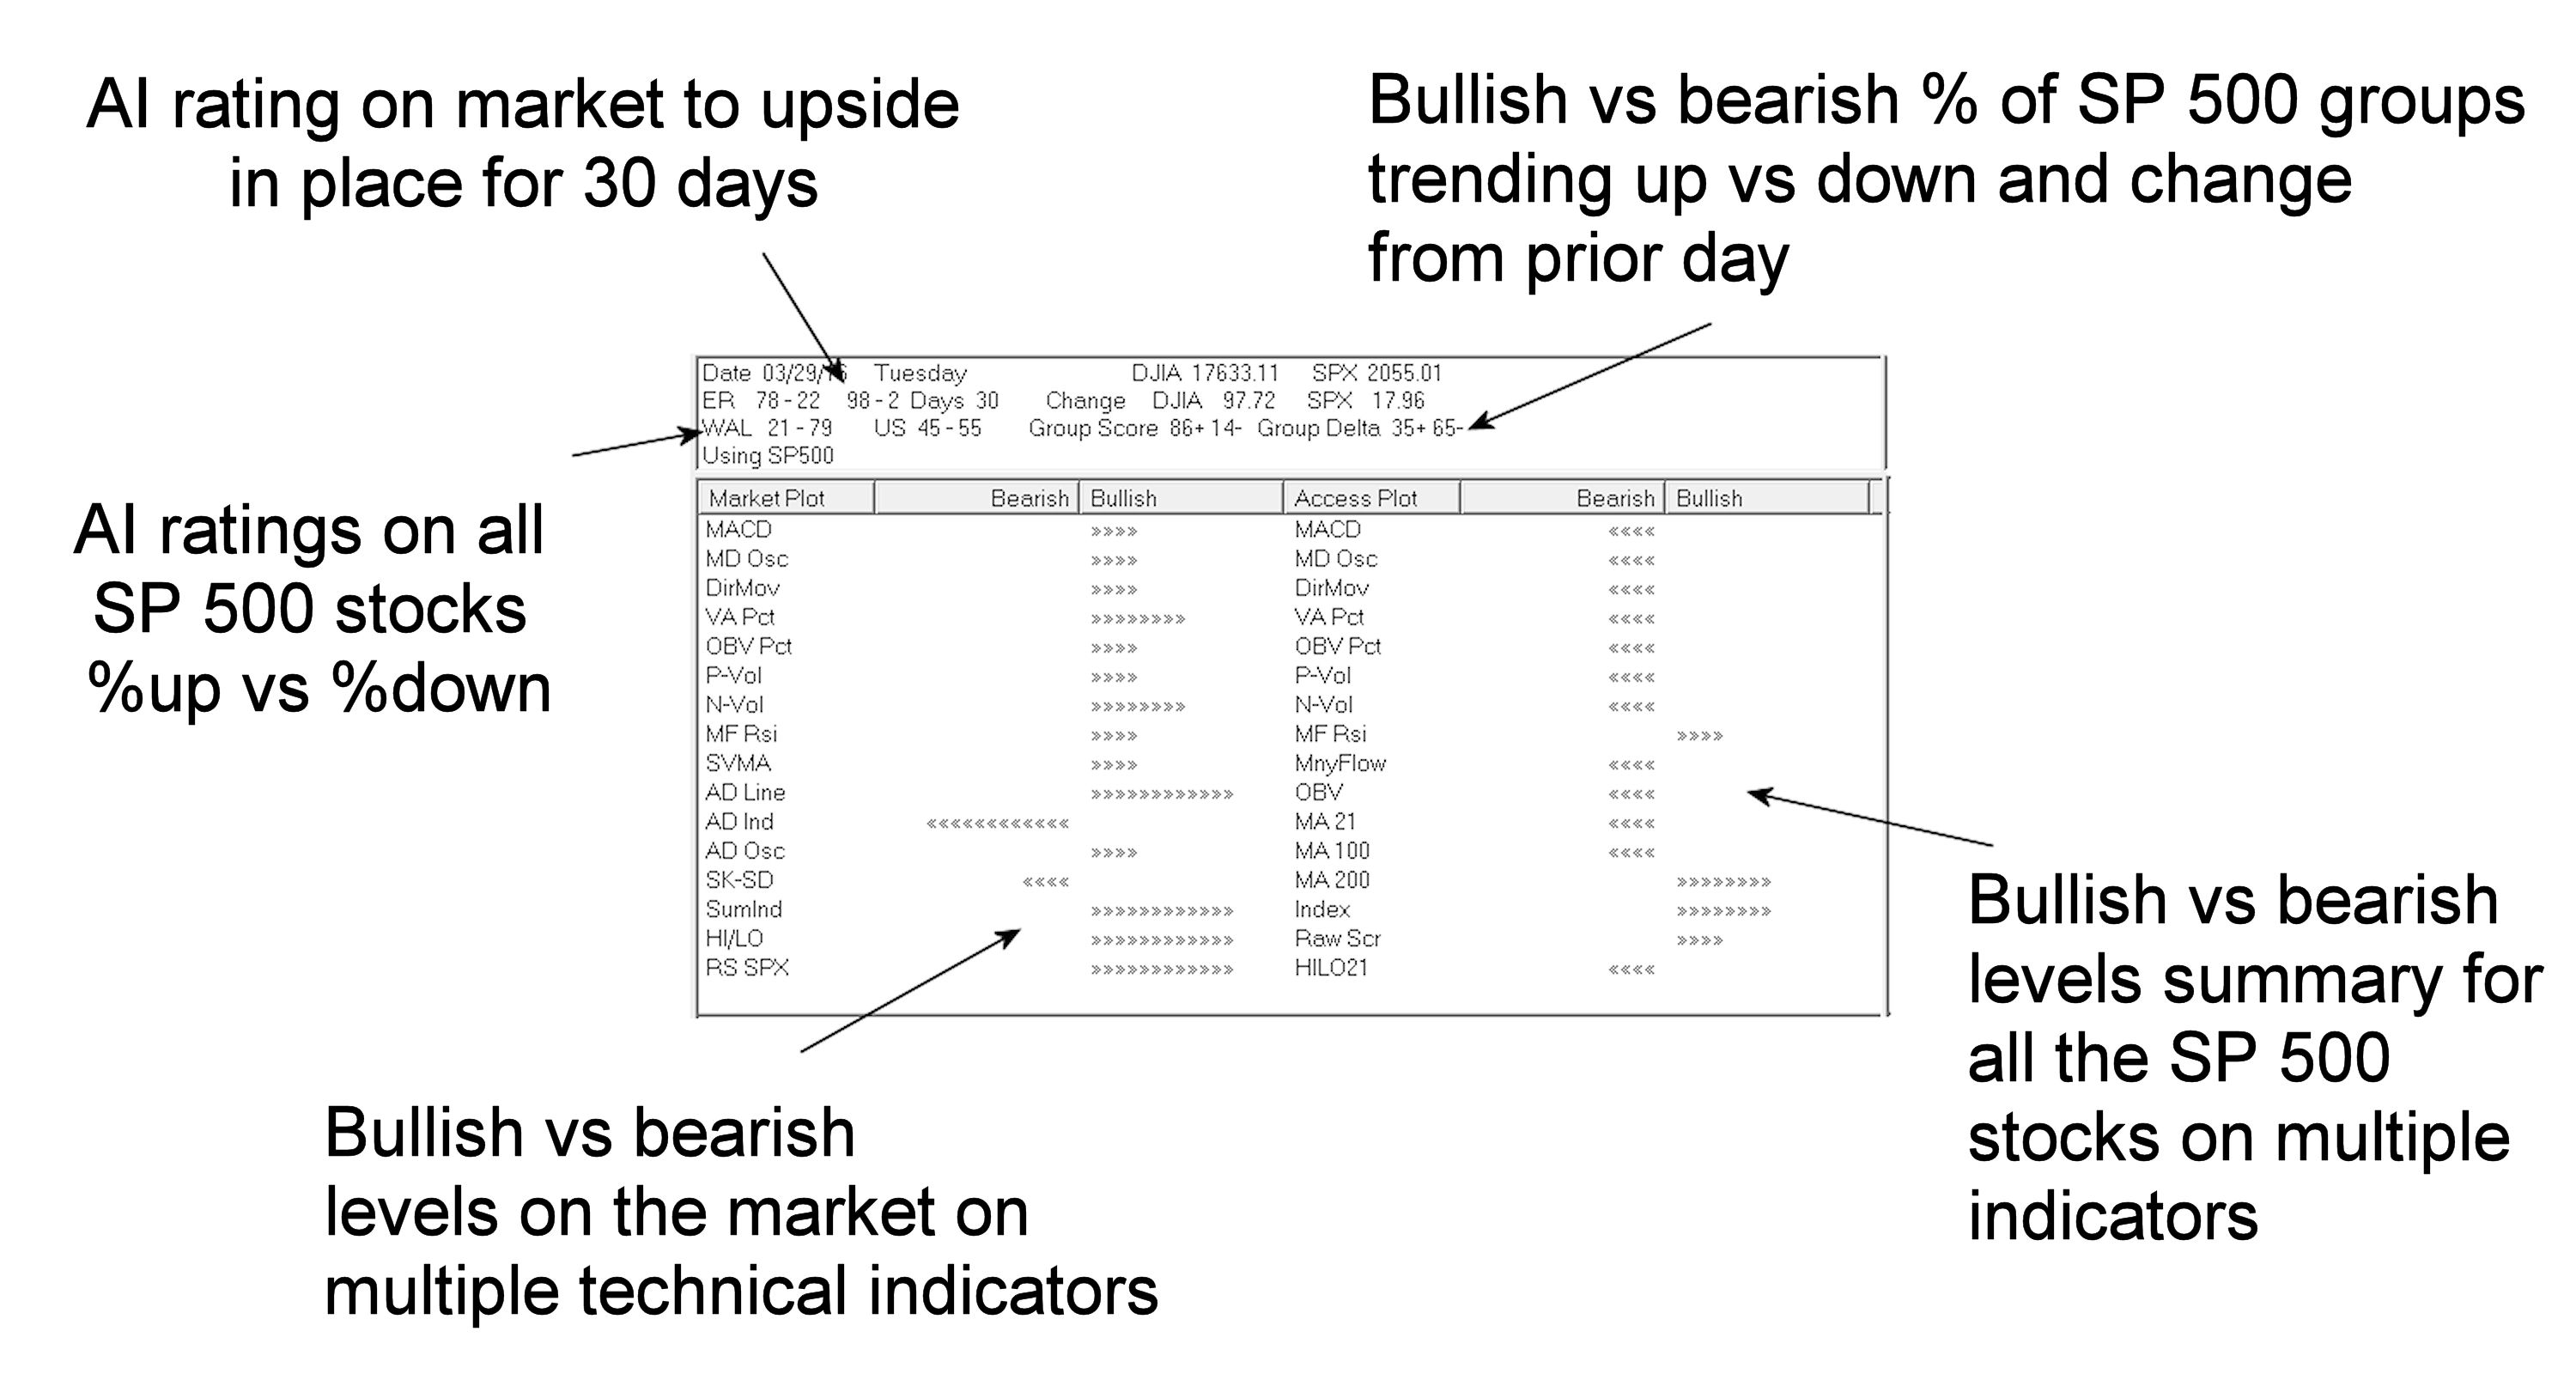
In your WinWay TradingExpert or TradingExpert Pro package, look for the icon for Reports and open it. The Market Log is toward the bottom of the list on the left.
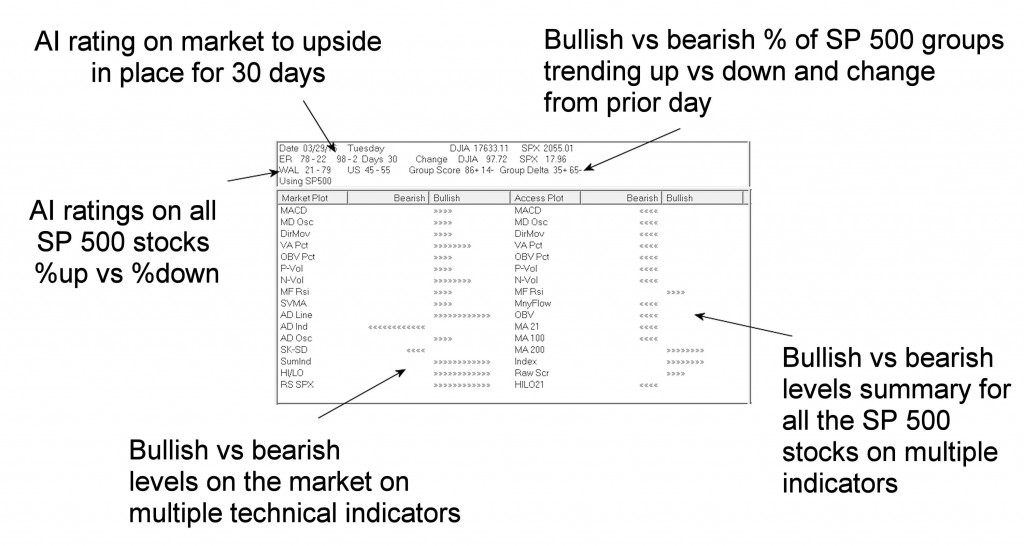
Trading and investing becomes clearer when you’re armed with this snapshot of the market and SP 500 stocks every day.
– AI rating on the market and how long it has been in place
– AI rating on all Sp 500 stocks percentage showing up ratings vs down ratings
– Bullish vs bearish levels on the market on multiple techncial indicators
– Bullish vs bearish percentage of SP 500 groups trending up vs down and the change from prior day
– Bullish vs bearish levels summary for all the SP 500 stocks on multiple indicators
Mar 29, 2016 | EDS code, Expert Design Studio, indicators
Here is some code for use in AIQ based on Markos Katsanos’s article in this issue, “Trading The Loonie.” The code and EDS file can be downloaded from www.TradersEdgeSystems.com/traderstips.htm.
The code I am providing contains both the divergence indicator and a long-only trading system for the NASDAQ 100 list of stocks. Along with fx trading online, I wanted to try the divergence idea and the author’s entry rules on the NASDAQ 100 stocks. The stocks are traded long using the author’s entry rules with two of the parameters adjusted as shown at the top of the code file. The exit has been changed completely to use a profit protect (protect 50% of profits once a 20% profit is reached), a stop-loss (protect 75% of capital), and a time-stop exit (exit after 21 days). I used the NASDAQ 100 index (NDX) in place of the crude oil futures. The assumption is that since the stocks on the list are all in the NDX, they would generally be correlated to the index. The author’s entry rule filters out those with a negative correlation to the index. Note that I changed the minimum correlation from a -0.4 to 0.0. In addition, I found that increasing the minimum divergence from 20 to 2,000 increased the Sharpe ratio and decreased the maximum drawdown without affecting the annualized return.
Figure 6 shows the equity curve versus the NASDAQ 100 index for the period 1/5/2000 to 10/14/2015. Figure 7 shows the metrics for this same test period. The system clearly outperformed the index.
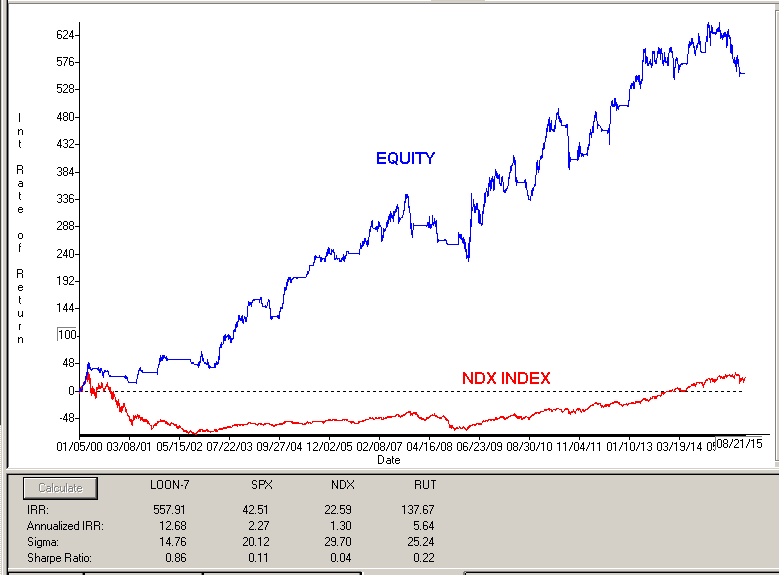
FIGURE 6: AIQ. Here is a sample equity curve for the modified divergence system versus the NASDAQ 100 index for the period 1/5/2000 to 10/14/2015.
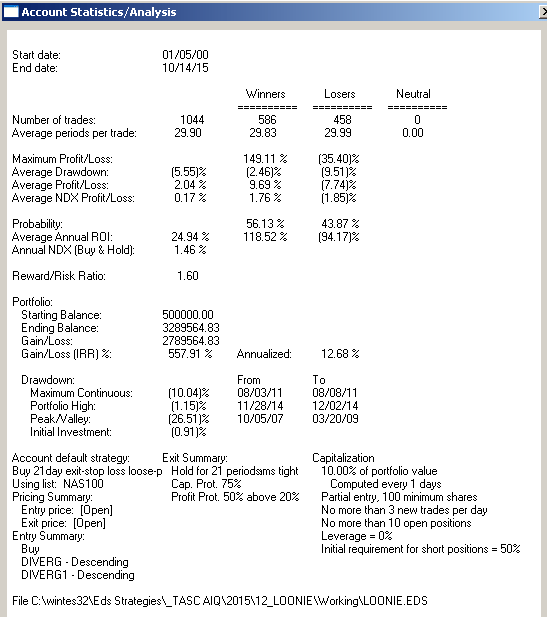
FIGURE 7: AIQ. Here are the metrics for the modified system and the test settings.
!TRADING THE LOONIE
!Author: Markos Katsanos, TASC December 2015
!coded by: Richard Denning 10/17/15
!www.TradersEdgeSystems.com

!Set parameters:
 Define Len        20. !Default is 20
 Define F1          2. !Default is 2
 Define F2          4. !Default is 4
 IDX is         "NDX". !NASDAQ 100 index
 IDXsLen is        40. !Default is 40
 minDIVERG is    2000. !Default is 20
 minROC is          0. !Default is 0
 minCorrel is     0.0. !Default is -0.4

!Close percent relative to BB band width for stock:
Variance is Variance([close],Len).
StdDev is Sqrt(Variance).
SMA is simpleavg([close],Len).
stkBB is 1+([close]-SMA+F1*StdDev)/(F2*StdDev).

!Close percent relative to BB band width for index:
IDXc is tickerUDF(IDX,[close]).
VarianceIdx is Variance(IDXc,Len).
StdDevIDX is Sqrt(Variance).
SMAidx is simpleavg(IDXc,Len).
idxBB is 1+(IDXc-SMAidx+F1*StdDevIDX)/(F2*StdDevIDX).

DIVERG is (idxBB-stkBB)/stkBB*100.     !PLOT AS CUSTOM INDICATOR
DIVERG1	is valresult(DIVERG,1).
ROC2 is ([close]/val([close],2)-1)*100.
ROC3 is ([close]/val([close],3)-1)*100.
ROC3idx is tickerUDF(IDX,ROC3).
IDXsma is simpleavg(IDXc,IDXsLen).
IDXsma2 is valresult(IDXsma,2).
HHVdiverg is highresult(DIVERG,3).

Setup1 if highresult(DIVERG,3) > minDIVERG.
Setup2 if DIVERG < valresult(DIVERG,1).
Setup3 if ([close]/val([close],2)-1)*100 > minROC.
Setup4 if IDXsma > valresult(IDXsma,2).
Setup5 if pCorrel > minCorrel.

Buy if 	Setup1 and
	Setup2 and
	Setup3 and
	Setup4 and
	Setup5.

BuyAlt if Buy.

LongExit1 if MACD<sigMACD and valrule(MACD>sigMACD,1) and
	     Stoch > 85.
LongExit2 if lowresult(DIVERG,3)<-20 and ROC3idx<-0.4.
LongExit3 if [close]<loval([close],15,1) and pCorrel<minCorrel.
LongExit if LongExit1 or LongExit2 or LongExit3.

AlterLongExit if {position days} >=21 or [close] <= (1-0.25)*{position entry price}.

!Code to Calculate Pearson's R [for entry]:
! PeriodtoTest is the number of lookback days.
! IndexTkr is the Instrument that you which to compare your list to.
PeriodToTest is Len.
IndexTkr is IDX.
ChgTkr is ([open] / val([open],PeriodToTest)-1)*100.
ChgIdx is TickerUDF(IndexTkr,ChgTkr).
Alpha is ChgTkr - ChgIdx.

ValUDF is (([close]-[open])/[open]) * 100.
ValIndex is TickerUDF(IndexTkr, ValUDF).
ValTkr is ValUDF.
SumXSquared is Sum(Power(ValIndex,2), PeriodToTest).
SumX is Sum(ValIndex, PeriodToTest).
SumYSquared is Sum(Power(ValTkr,2), PeriodToTest).
SumY is Sum(ValTkr, PeriodToTest).
SumXY is Sum(ValTkr*ValIndex, PeriodToTest).
SP is SumXY - ( (SumX * SumY) / PeriodToTest ).
SSx is SumXSquared - ( (SumX * SumX) / PeriodToTest ).
SSy is SumYSquared - ( (SumY * SumY) / PeriodToTest ).

!Pearson's R and Pearson's Coefficient of Determination:
pCorrel is SP/SQRT(SSX*SSY).

!Code to Calculate Pearson's R [for exit]:
! PeriodtoTest is the number of lookback days.
! IndexTkr is the Instrument that you which to compare your list to.
PeriodToTestX is 3*Len.
IndexTkrX is IDX.
ChgTkrX is ([open] / val([open],PeriodToTestX)-1)*100.
ChgIdxX is TickerUDF(IndexTkrX,ChgTkrX).
AlphaX is ChgTkrX - ChgIdxX.

ValUDFX is (([close]-[open])/[open]) * 100.
ValIndexX is TickerUDF(IndexTkrX, ValUDFX).
ValTkrX is ValUDFX.
SumXSquaredX is Sum(Power(ValIndexX,2), PeriodToTestX).
SumXX is Sum(ValIndexX, PeriodToTestX).
SumYSquaredX is Sum(Power(ValTkrX,2), PeriodToTestX).
SumYX is Sum(ValTkrX, PeriodToTestX).
SumXYX is Sum(ValTkrX*ValIndexX, PeriodToTestX).
SPX is SumXYX - ( (SumXX * SumYX) / PeriodToTestX).
SSxX is SumXSquaredX - ( (SumXX * SumXX) / PeriodToTestX ).
SSyX is SumYSquaredX - ( (SumYX * SumYX) / PeriodToTestX ).

!Pearson's R and Pearson's Coefficient of Determination:
pCorrelX is SPX/SQRT(SSXX*SSYX).

!MACD code:
S is 12.
L is 25.
X is 9.

ShortMACDMA is expavg([Close],S).
LongMACDMA is expavg([Close],L).

MACD is ShortMACDMA-LongMACDMA.
SigMACD is expavg(MACD,X).

!Stochastic
StochLen is 30.
Stoch is 100 * (([Close]-LoVal([Low],StochLen)) /
	(HiVal([High],StochLen) - LoVal([Low],StochLen))).

List if 1.
—Richard Denning
info@TradersEdgeSystems.com
Mar 29, 2016 | EDS code, trading strategies
The TradingExpert code based on Ken Calhoun’s article in the March 2016 issue of Stocks and Commodities, “ADX Breakouts,” is provided at below.
Since I mainly work with daily bar strategies, I wanted to test the ADX concept from the article on a daily bar trading system. So I set up a system that buys after a stock has based around the 200-day simple moving average (Basing200). Basing200 is coded in the system as:
- The stock closing above the 200-SMA only 19 bars or less out of the last 100 bars, and
- The stock closing greater than two bars above the 200-SMA in the last 10 bars.
For exits, I used the following built-in exits: a capital-protect exit set at 80% and a profit-protect exit set at 80% once profit reaches 5% or more.
I ran this system on the NASDAQ 100 list of stocks in the EDS backtester over the period 12/31/1999 to 1/11/2016. I then ran a second test on the system using the ADX filter (ADX must be greater than 40 at the time of the signal to buy). I used the same list of stocks, exits, and test period.
Figure 8 shows the first test without the filter: 883 trades, 1.84% average profit per trade, 1.51 reward/risk. Figure 9 shows the second test with the filter: 151 trades, 2.12% average profit per trade, 1.66 reward/risk.
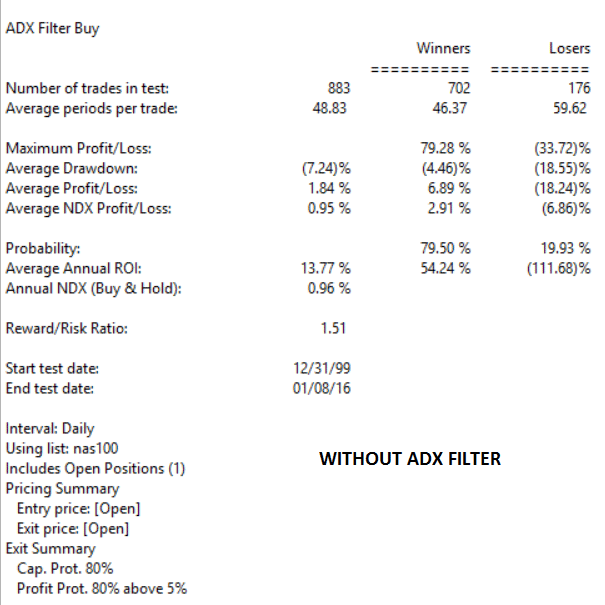
FIGURE 8: WITHOUT FILTER. Here are the EDS test results for the example system without the ADX filter.
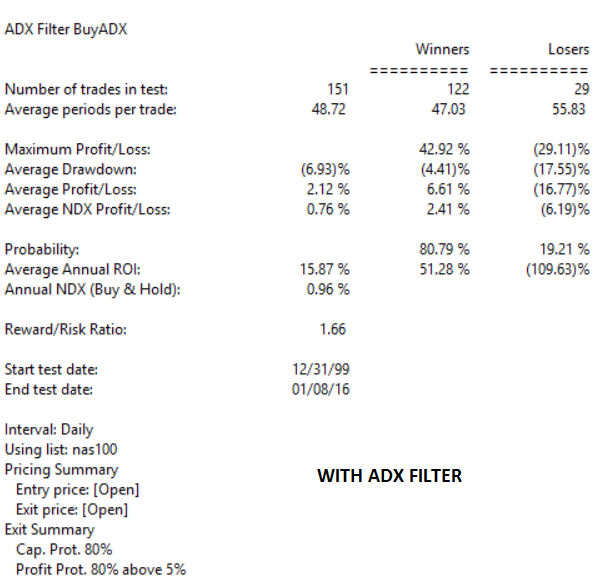
FIGURE 9: AIQ, WITH FILTER. Here are the EDS test results for the example system with the ADX filter.
Although all of the key metrics are better with the filter, there is a significant reduction in the number of trades. In fact, 151 trades would not be sufficient for a trading system over this long test period. If one wanted to use the filter, then the list of stocks would need to be increased to about 2,000 stocks.
!ADX BREAKOUTS
!Author: Ken Calhoun, TASC March 2016
!Coded by: Richard Denning, 1/11/2016
!www.TradersEdgeSystems.com

!NOTE; THIS SAMPLE SYSTEM IS FOR
           !DAILY BAR TESTING OF ADX FILTER ONLY

SMA200 is simpleavg([close],200).
HD is hasdatafor(250).
Above200 if ( [close] > SMA200 ) .
Basing200 if CountOf(Above200,10) >2
 and CountOf(Above200,100) <20 .="" and="" basing200="" buy="" hd="" if="">200.
ADXhi if [ADX] >= 40.
BuyADX if Buy and ADXhi.
Sep 25, 2015 | color studies, EDS code
The WinWay EDS code based on Vitali Apirine’s June 2015 article in S&C, “The Slow Volume Strength Index,” is provided for download from the following website:
www.TradersEdgeSystems.com/traderstips.htm
!THE SLOW VOLUME STRENGTH INDEX
!Author: Vitali Aiprine, TASC April 2015
!Coded by: Richard Denning 6/10/2015
!www.TradersEdgeSystems.com
!INPUTS FOR INDICATOR:
emaLen is 6.
wilderLen is 14.
!INDICATOR FORMULAS:
ema is expavg([close],emaLen).
pDif is iff([close] – ema > 0,[volume],0).
nDif is iff([close] – ema < 0,[volume],0).
rsiLen is 2 * wilderLen – 1.
AvgU is expavg(pDif,rsiLen).
AvgD is expavg(nDif,rsiLen).
svsi is 100-(100/(1+(AvgU/AvgD))). !PLOT
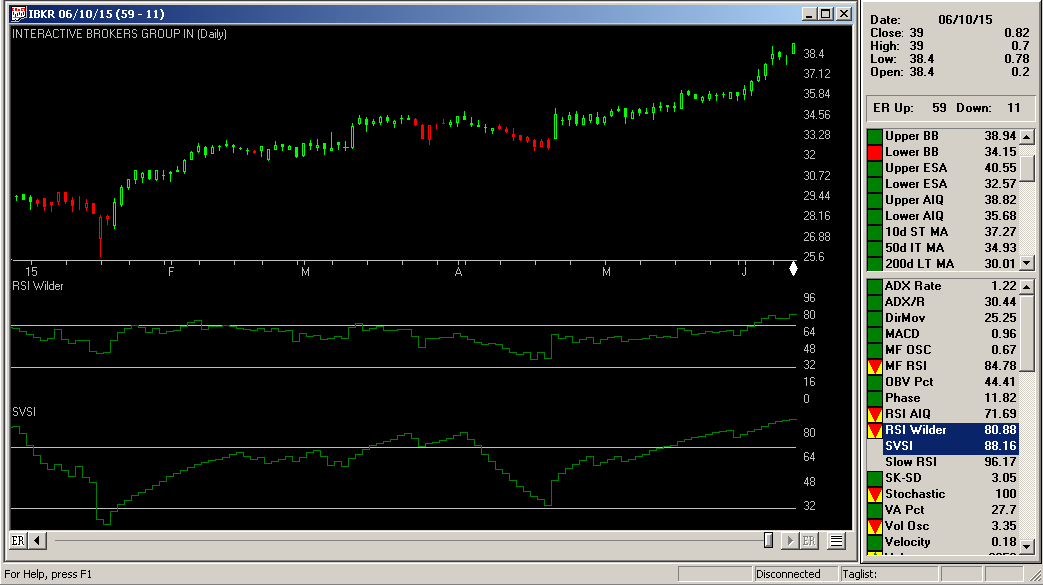
The code provided for the slow volume strength index (SVSI) may be plotted as an indicator, as shown in Figure 6.
Sample Chart
FIGURE 6: WinWay TradingExpert Pro Charts. Here is the SVSI (6,14) indicator compared to the classic RSI (14).
—Richard Denning
info@TradersEdgeSystems.com
for AIQ Systems
Nov 26, 2014 | Uncategorized
It is not a little known fact that historically the action of the stock market has been relatively favorable both around holidays and towards the end of the year. But some question remains as to just how favorable things have been during these periods and how often. So let’s address it.
The Year-End (or “Santa Claus”) Rally
Different analysts will look at historical data and draw different conclusions. This is actually a good thing, otherwise everyone would be trying to buy or sell at the same time.
But in the opinion one analyst (“Hi, my name is Jay”) the “year-end rally” period (or as I like to call it the “Santa Claus Rally”):
*Starts on the Monday before Thanksgiving
*Ends at the close of the third trading day of the following January
Have I mentioned lately that this stuff doesn’t need to be rocket science?
So how has this period performed? We will start our test at the close of trading on Saturday (yes, Saturday) November 19, 1949 and examine what would have happened to a hypothetical $1,000 investment in the Dow Jones Industrials Average that was in the market only during the bullish year-end period described above (in other words, the trader would buy the Dow Industrials Average at the close on the last trading day prior to the Monday before Thanksgiving and would hold through the close of the third trading day of the following January. The rest of the time the “system” is out of the market. For our purposes, no interest is earned so as to reflect only the gains made during the bullish year-end period).
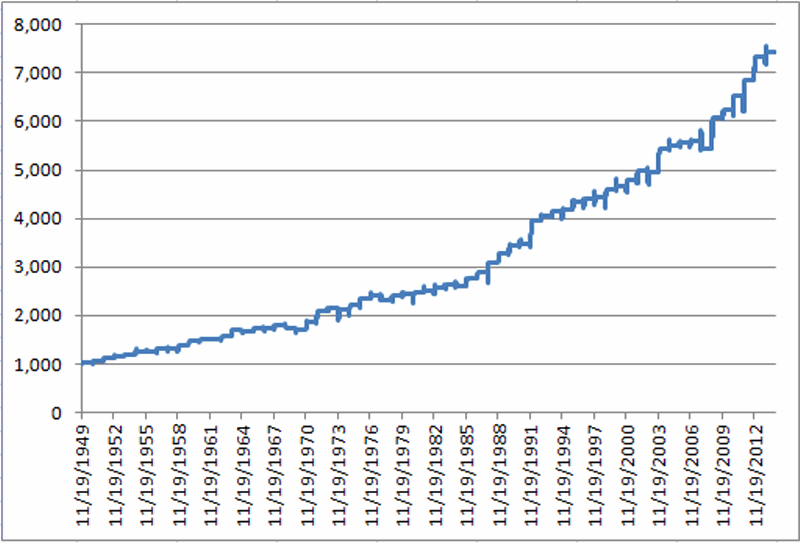
The results appear in chart form in Figure 1.
Figure 1 – Growth of $1,000 invested in the Dow Industrial Average only during the bullish year-end period described in text
Figure 2 displays the annual year-by-year results in table form.
|
Exit Date
|
% +(-)
|
|
1/5/50
|
3.6
|
|
1/4/51
|
4.0
|
|
1/4/52
|
3.9
|
|
1/6/53
|
4.6
|
|
1/6/54
|
2.9
|
|
1/5/55
|
5.1
|
|
1/5/56
|
0.2
|
|
1/4/57
|
3.7
|
|
1/6/58
|
(0.0)
|
|
1/6/59
|
5.7
|
|
1/6/60
|
5.8
|
|
1/5/61
|
3.2
|
|
1/4/62
|
(1.0)
|
|
1/4/63
|
5.0
|
|
1/6/64
|
8.2
|
|
1/6/65
|
(1.2)
|
|
1/5/66
|
3.0
|
|
1/5/67
|
(0.5)
|
|
1/4/68
|
4.3
|
|
1/6/69
|
(3.1)
|
|
1/6/70
|
(2.4)
|
|
1/6/71
|
10.0
|
|
1/5/72
|
11.6
|
|
1/4/73
|
3.4
|
|
1/4/74
|
(1.2)
|
|
1/6/75
|
3.6
|
|
1/6/76
|
6.0
|
|
1/5/77
|
3.1
|
|
1/5/78
|
(3.7)
|
|
1/4/79
|
3.6
|
|
1/4/80
|
1.6
|
|
1/6/81
|
1.5
|
|
1/6/82
|
0.9
|
|
1/5/83
|
2.3
|
|
1/5/84
|
2.5
|
|
1/4/85
|
(0.3)
|
|
1/6/86
|
5.7
|
|
1/6/87
|
4.3
|
|
1/6/88
|
6.5
|
|
1/5/89
|
6.2
|
|
1/4/90
|
5.4
|
|
1/4/91
|
0.6
|
|
1/6/92
|
13.9
|
|
1/6/93
|
2.4
|
|
1/5/94
|
2.8
|
|
1/5/95
|
0.9
|
|
1/4/96
|
3.7
|
|
1/6/97
|
1.5
|
|
1/6/98
|
0.3
|
|
1/6/99
|
4.2
|
|
1/5/00
|
1.1
|
|
1/4/01
|
2.7
|
|
1/4/02
|
4.0
|
|
1/6/03
|
(0.4)
|
|
1/6/04
|
9.5
|
|
1/5/05
|
1.3
|
|
1/5/06
|
1.1
|
|
1/5/07
|
0.4
|
|
1/4/08
|
(2.9)
|
|
1/6/09
|
12.0
|
|
1/6/10
|
2.5
|
|
1/5/11
|
4.6
|
|
1/5/12
|
5.3
|
|
1/4/13
|
6.7
|
|
1/6/14
|
1.6
|
Figure 2 – Year-by-Year “Santa Claus Rally” % +(-)
A few performance notes:
# times UP = 54 (83% of the time)
# times DOWN = 11 (17% of the time)
Average% +(-) = +3.19%
Median % +(-) = +3.08%
Largest % Gain = +13.87% (1991-92)
Largest % Loss = (-3.69%) (1977-78)
It is also worth noting that the year-end rally period has witnessed a gain for the Dow in 27 of the last 29 years and 33 of the last 36 years.
Summary
So do the results displayed in Figures 1 and 2 guarantee that the stock market is destined to rally in the near future? Ah there’s the rub. For the answer is “not necessarily”. Still, investing is in many ways a game of odds and probabilities. While one always needs to be prepared to act defensively if things start to go south, history suggests that traders and investors might do well to give the bullish case the benefit of the doubt between Thanksgiving Week and early January 2015.
Or to put it more succinctly:
Jay’s Trading Maxim #215: Santa Claus is real (approximately 83% of the time).
Jay Kaeppel
Chief Market Analyst at JayOnTheMarkets.com and AIQ TradingExpert Pro (http://www.aiq.com) client
http://jayonthemarkets.com/
Jay has published four books on futures, option and stock trading. He was Head Trader for a CTA from 1995 through 2003. As a computer programmer, he co-developed trading software that was voted “Best Option Trading System” six consecutive years by readers of Technical Analysis of Stocks and Commodities magazine. A featured speaker and instructor at live and on-line trading seminars, he has authored over 30 articles in Technical Analysis of Stocks and Commodities magazine, Active Trader magazine, Futures & Options magazine and on-line at www.Investopedia.com.

 English