Oct 10, 2018 | indexes, market timing, Portfolio management, Risk management, stock market, Stock trading
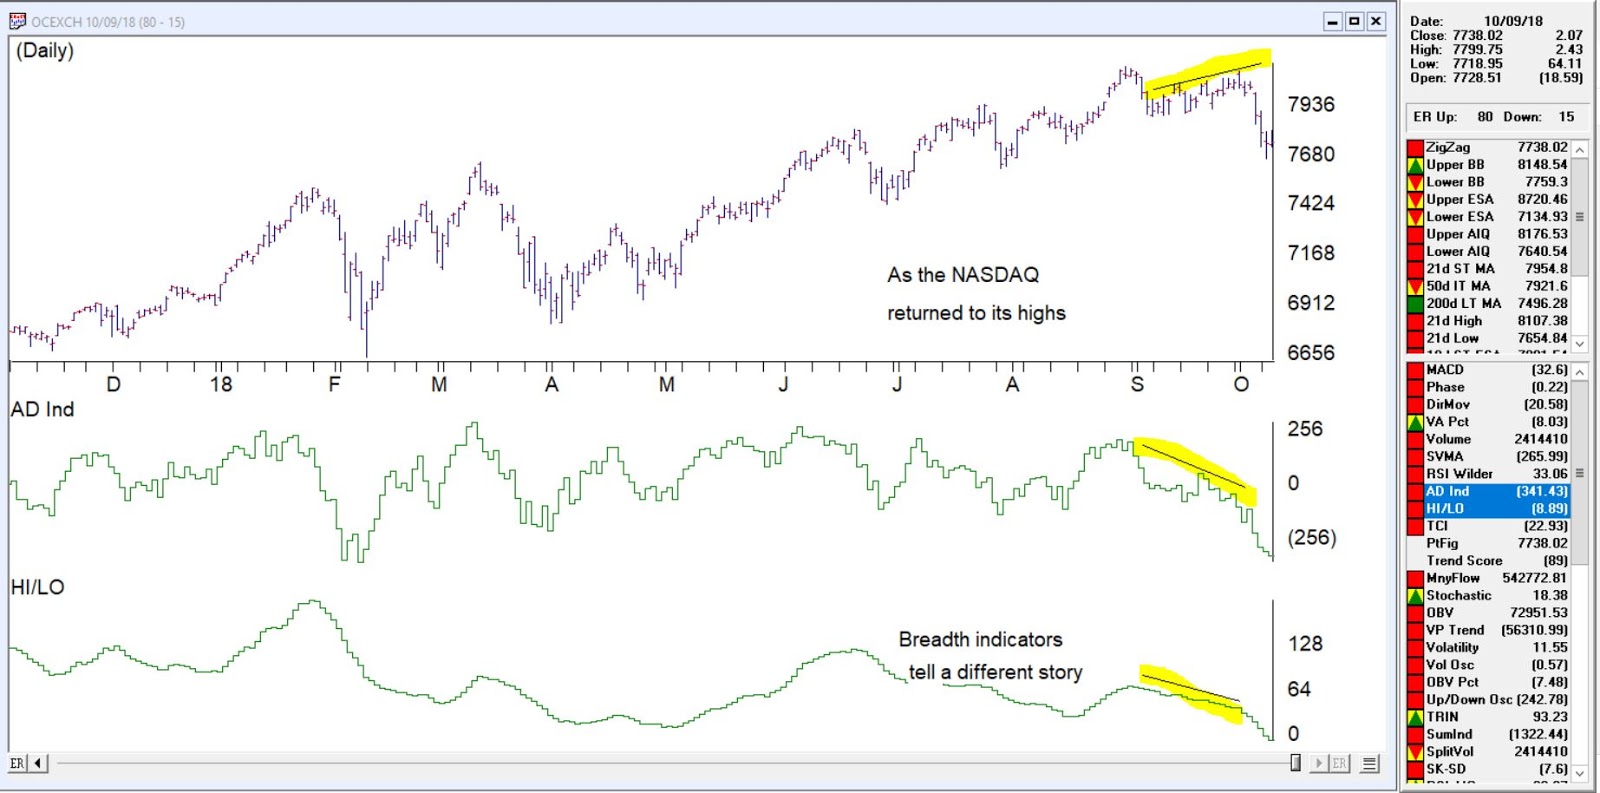
Working on some slides for a seminar last week, it was apparent that breadth indicators on the NASDAQ signaled a divergence from the price action of the market.
Looking specifically at AD Ind and HI/LO, although other breadth measures told the same tale.
The AD indicator explained
The Advance/Decline Indicator is an exponentially weighted average of the net advancing versus declining issues. With this indicator, the direction of the trend is of importance and not the actual value of the indicator. When the indicator is increasing, advances are outweighing declines, and when it is decreasing, there are more declining issues than advancing.
The Advance/Decline Indicator is a breadth indicator very similar to the Advance/Decline Line. However, this indicator tends to be more sensitive and at times will signal a move earlier than the Advance/Decline Line.
The breadth was telling us something was amiss from last week. Take a look at this chart of the NASDAQ clearly a divergence was in place before the downturn.
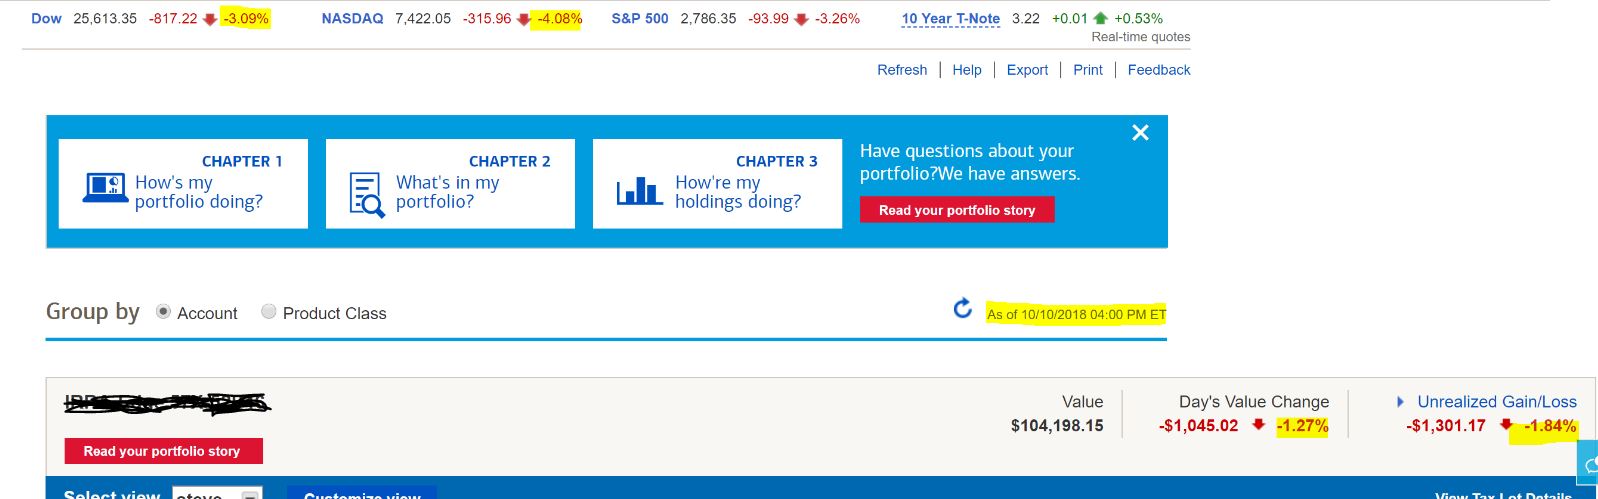
Today’s (10-10-18) 316 point drop in the NASDAQ a 4% drop and nearly 9% drop from the high is close to the 10% corrective point and some buyers may come in over the next few days and keep the decline in check or not.
The markets are down between 6 and 10% in 5 days. Keeping good stops is a must in your portfolio to protect you from the worst of this. Using trailing stops between 7 and 10 % on stocks that are moving and protective stops 5 to 7 % below initial investment for example can easily reduce your losses in these volatile markets.
Feb 7, 2014 | Portfolio management, Risk management, trading strategies
Risk denotes the probability of an outcome, when an individual places an investment of value in the path of forces outside their control. Straightaway the madness of this practice is revealed, yet the pages of history are littered with those that have brought about the greatest advances mankind has ever made in return for risking something of value.
It may be interesting to note that the volatility of the recent global financial crisis saw the advent of many newcomers onto the BRW Rich List in 2008, and the contention that risk is defined by the market falling is not to the point. Today, due to the very existence of derivatives such as options, swaps and forward rate agreements, an individual can direct risk and return to almost every possible market contingency, regardless of the volatility exhibited.
The Bell Curve represents a distribution of events, with the ‘bell’ representing those events that are most likely; events that are in close proximity to present market price. These resemble at-the-money options.
As we get further away from conditions prevailing at the time, the likelihood of particular events occurring will not only decrease, but will decrease in probability at an increasing rate. These less likely events take their place along the tapering edges of the bell, extending to both extremes. A pricing model attributes time value in this very fashion.
The standard deviation is the unit used to measure the probabilities transgressed from the status quo, to the market price when a particular event occurs. These measured intervals decrease in size, as the two poles of this dimension are approached; the difference between a movement of one standard deviation and two standard deviations will be far greater than that of seven deviations and eight standard deviations.
Primarily, this is due to the fact that there is little difference between probabilities that are small with other probabilities of that class, and similarly, little difference between probabilities that are high with members of that class also. They are described at a high level of abstraction that classifies them broadly as ‘high’ or ‘low’ probability.
However, when events of low probability are compared with those that are of high probability, a happening may be for example, said to be effected by a movement across seven standard deviations. In this event it is a rare occurrence indeed. When volatility is high, it is useful to note that not only are the entire bell and its tapered edges lifted higher on the plane, but the edges of the bell, move closer in gradient to the body. In higher volatility, this is directly due to the indiscriminate application of an increased probability in all possible events. The opposite will be found in low volatility with in this case, the actual bell of the curve becoming much smaller.
Accordingly, a matrix of probabilities is able to be placed in perspective.
Heavily reliant on reason, the contention that price and quality are inexorably attached is well founded in history. Even more so in perfect markets, at very least we can state with confidence that low risk and high risk are not uniformly priced. While the perception of value is a personal value judgment, what is most definite is that markets provide returns that are commensurate with the risk undertaken.
Consideration of the capital needed to fund a position, and also a variety of possible market outcomes must firmly occupy the consciousness of every trader. Insight into one’s own ability to function under the weight of risk is also crucial to profitability, as decision making needs to be carried out as free of subjective influences as possible. At any length, a good rule of thumb will be to allow 25% of risk capital to remain free for unexpected contingencies.