Sep 17, 2012 | Uncategorized
Couple of chart patterns appeared in the Chart Pattern EDS report for 9-17-2012.
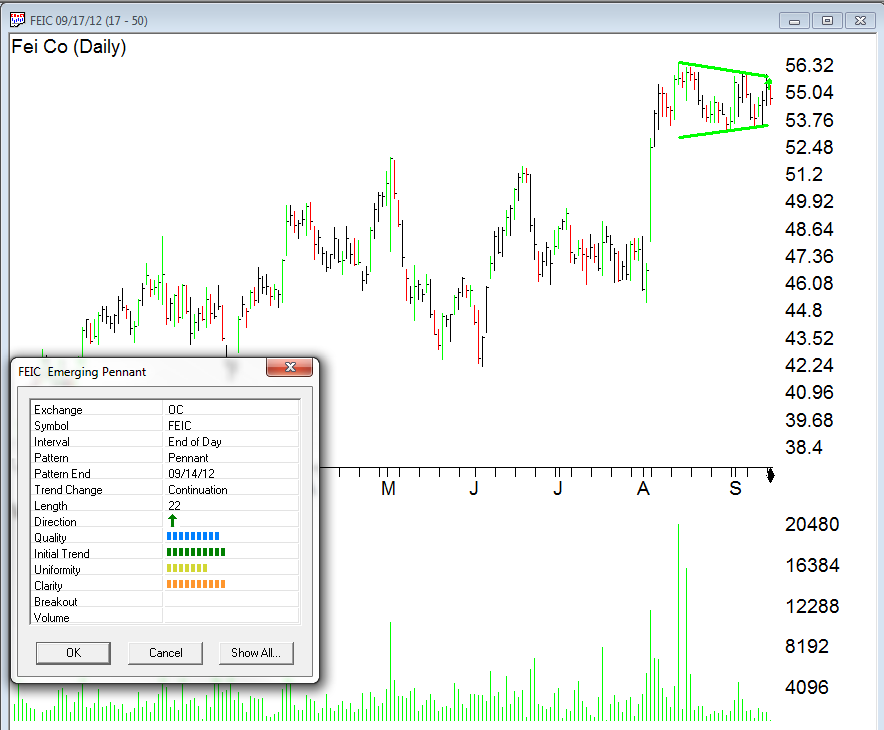
FEIC emerging pennant
FEIC had a sharp move up at the beginning of August and has since been forming a pennant pattern. The clarity, quality and initial trend for the pattern are very good. The length of the pennant part of the pattern is getting a little long in the tooth but still could resolve. Usually pennants are completed with a breakout to the upside through the upper trendline followed by an increase in volume.
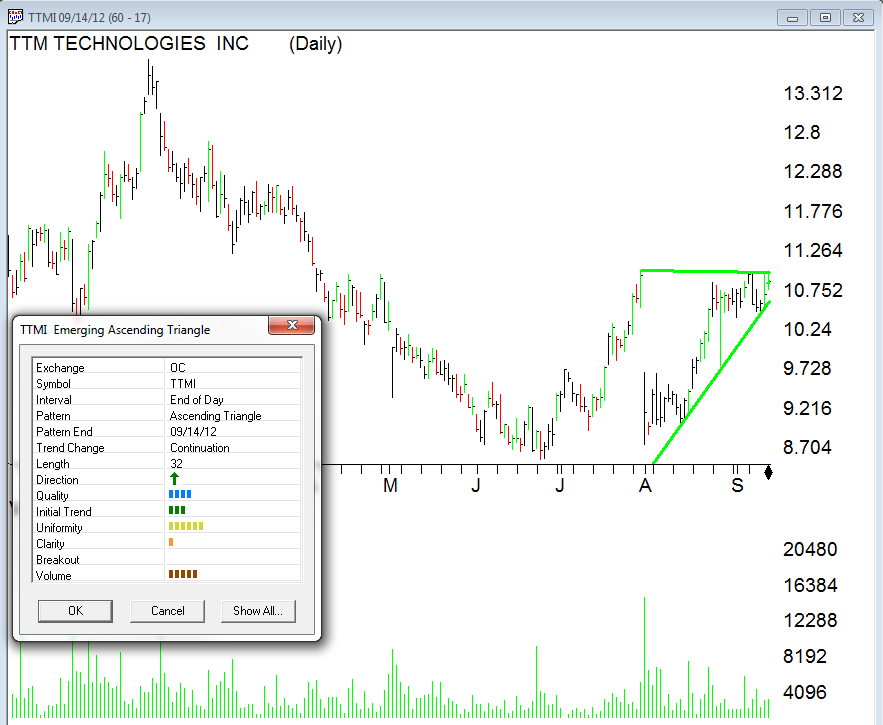
TTMI merging ascending triangle
TTMI has a nice ascending triangle forming, the stock closed at 10.7 today and is still within the triangle. Diminishing volume is typical of this pattern. Breakout occurs usually to the upside through the horizontal trendline and needs to happen with good volume.
More information on Chart Pattern Recognition in TradingExpert Pro can be found at http://www.aiqsystems.com/chartpatterns.htm
Aug 29, 2012 | Uncategorized
The AIQ code for Vladimir Vladimirovich Voznjuk’s article in this issue, “Developing A Multilevel Strategy,” is provided at www.TradersEdgeSystems.com/traderstips.htm, and is shown below.
Although AIQ software can chart and test forex data, testing stocks is more interesting. Using the author’s concept of trading using multiple instruments to generate signals, I designed a system that uses both the group index for a stock and the SPX. The multi-instrument indicator that I designed uses the 20-day rate of change in price for the stock and its related group, which is then smoothed by a simple average over 20 days. I then take a ratio of the stock’s smoothed rate of change to its related group’s smoothed rate of change. Finally, I take a stochastic of this ratio (“StoMSG”). The system goes long when the stock, group, and SPX index are in uptrends as measured by the direction of their 50-day simple moving average (higher than it was 10 days ago) and in addition, for the stock and group, the 20-day rate of change is greater than zero. Buy when the trend is up (as defined here) and the StoMSG is less than or equal to 10. Exit longs when one of the following is met: the position has been held for 20 days, or the StoMSG is greater than or equal to 90, or the simple average of the SPX close is less than its value 10 days ago.
To test the multimarket group stock system using the Portfolio Manager for the period 1/1/1999 to 7/18/2012, a trading simulation was run with the following capitalization settings:
– Maximum of 10 open positions
– Size each position at 10% of mark-to-market total capital
– Take no more than 10 new positions per day
– Compute the mark-to-market capital each day
– Choose signals based on a relative strength indicator for ranking in descending order for longs (long-only system)
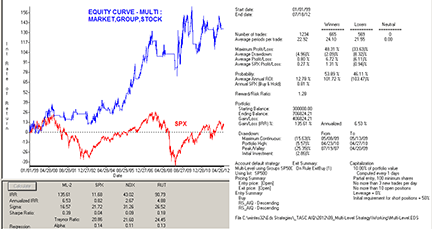
In Figure 1, I show the resulting statistics and equity curve compared to the SPX. The test was run using the S&P 500 group/section structure that can be downloaded from the AIQ website for the period 1/1/1999 to 7/18/2012. AIQ allows for the creation of custom group and sector structures and also has two structures, the S&P 500 and the AIQALL. The S&P 500 groups contain just the stocks in the S&P 500, while the AIQALL groups have most of the stocks that can be traded.
FIGURE 1: AIQ, MULTI-INSTRUMENT TEST SYSTEM. Here is an equity curve for my test system that uses the multi-instrument concept for the period 1/1/1999 to 7/18/2012. The S&P 500 group/sector structure was used for the secondary instruments and the S&P 500 stocks were traded.
!DEVELOPING A MULTI-LEVEL STRATEGY
!Author: Vladimir Voznjuk, TASC Sept 2012
!Coded by: Richard Denning 7/16/2012
!www.TradersEdgeSystems.com
! ABBREVIATIONS:
C is [close].
Cx is valresult(C,20).
O is [open].
avgV is simpleavg([volume],50).
PEP is {position entry price}.
PD is {position days}.
Name is description().
Group is tickerUDF(rsTicker(),name).
GrpSym is tickerUDF(rsTicker(),symbol()).
GrpO is tickerUDF(rsTicker(),O).
GrpC is tickerUDF(rsTicker(),C).
GrpCx is valresult(GrpC,20).
!UDFs FOR INDICATOR & SYSTEM:
StkCOPct is simpleavg((C – Cx ) / Cx * 100,20).
GrpCOPct is simpleavg((GrpC – GrpCx) / GrpCx * 100,20).
MA50 is simpleavg(C,50).
GrpMA50 is simpleavg(GrpC,50).
SPXma50 is tickerUDF(“SPX”,MA50).
MSG is StkCOPct / GrpCOPct.
!PLOT THE FOLLOWING WITH 90 & 10 LINES:
StoMSG is (MSG – lowresult(MSG,60)) /
(highresult(MSG,60) – lowresult(MSG,60)) * 100.
!REPORT TO LIST VALUES FOR A SINGLE DAY:
ShowValues if StkCOPct > 0
and MA50 > valresult(MA50,10)
and GrpCOPct > 0
and GrpMA50 > valresult(GrpMA50,10)
and C > 10 and avgV > 3000.
!TRADING SYSTEM RULES:
Buy if StoMSG <= 10
and StkCOPct > 0
and MA50 > valresult(MA50,10)
and GrpCOPct > 0
and GrpMA50 > valresult(GrpMA50,10)
and C > 0 and avgV > 3000
and SPXma50 > valresult(SPXma50,10).
ExitBuy if StoMSG >= 90
or PD >= 20
or SPXma50 < valresult(SPXma50,10).
!FOR RANKING SIGNALS FOR TRADING SIMULATION
! IN PORTFOLIO MANAGER:
!AIQ RELATIVE STRENGTH:
Price1 is C.
Price2 is O.
MTL is 30.
Q3m is MTL / 4.
Q2m is (MTL – Q3m) / 3.
Q1m is (MTL – Q2m – Q3m) / 2.
Q0m is MTL – Q1m – Q2m – Q3m.
ROCq3m is (valresult(price1,Q2m,(Q1m+Q0m)) /
valresult(price2,Q3m,(Q2m+Q1m+Q0m)) – 1) * 100.
ROCq2m is (valresult(price1,Q1m,Q0m) /
valresult(price2,Q2m,(Q1m+Q0m)) – 1) * 100.
ROCq1m is (valresult(price1,Q0m,0) /
valresult(price2,Q1m,Q0m) -1 ) * 100.
ROCq0m is (price1 / valresult(price2,Q0m,0) – 1) * 100.
RS_AIQ is ROCq0m * 0.40 + ROCq1m * 0.20
+ ROCq2m * 0.20 + ROCq3m * 0.20.
Jul 13, 2012 | Uncategorized
The AIQ code based on Giorgos Siligardos’ article in this issue, “Applying The Sector Rotation Model,” in July 2012 Stocks & Commodities is provided at the following website: www.TradersEdgeSystems.com/traderstips.htm.
Siligardos’ approach relies on sector ETFs. Since sector ETFs have limited price history, I searched for similar sector representations that would have more history. I found that there are S&P 500 sector indexes that start on 9/11/1989 and thus have almost 23 years of history.
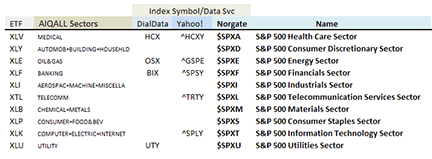
In the table in Figure 6, I show the symbols for the sector representations for the three data services DialData from Track Data, Yahoo! from yahoo.com, and PremiumData from Norgate. The first column of the table shows the ETF symbol. The second column shows the AIQALL (a group/sector list structure) sector symbols. You could code the sector rotation indicator using the program-computed sectors as shown, but the results will vary from user to user because the sector values depend on the stocks that are in the user’s database.
FIGURE 6: AIQ, SECTORS. Here are the symbols for the sector representations for the three data services DialData, Yahoo, and PremiumData from Norgate.
Since I couldn’t find symbols for some of the sectors at DialData and Yahoo, I decided to use the sector indexes from Norgate (shown in bold in Figure 6). AIQ can use data from any source by using the data transfer utility to import the data from ASCII text files. In the code file I provide, there is an input that allows you to switch between the ETF data symbols and the indexes (useIDX=0 for ETFs and useIDX=1 for indexes).
Please note that I changed the Norgate symbols upon import to remove the “$” as I wasn’t sure this symbol would be allowed as a ticker symbol. So the symbol “$SPXA” from Norgate is changed to “SPXA,” and so on. I have also provided extra code for the other sectors that are not used by the author in case you want to try using different sector combinations in the bull-bear indicator.
Since Siligardos does not provide a mechanical trading system that uses the indicator, I devised one that uses two moving averages of the bull-bear indicator: one set at 50 bars and the other set at 200 bars. Entries to go long occur when the fast average crosses over the slower average. I exit on cross downs or whenever the SPX 50-bar average is lower than it was 10 bars ago.
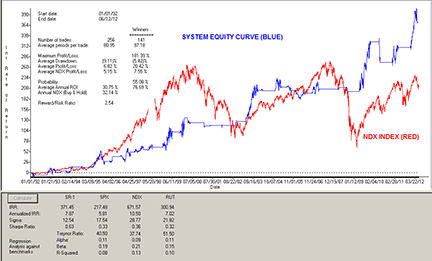
Since this is mainly a market timing device, I then tried trading the NASDAQ 100 list of stocks using the Portfolio Manager for the period 1/1/1992 to 6/12/2012. The following capitalization settings were used:
- Maximum of 10 open positions
- Size each position at 10% of mark-to-market total capital
- Take no more than 10 new positions per day
- Compute the mark-to-market capital each day
- Choose signals based on a relative strength indicator for ranking in descending order for longs (long-only system)
The resulting equity curve is shown in Figure 7, which is compared to the NASDAQ 100 index (NDX). With these settings, the internal rate of return averaged 7.9% with a maximum drawdown of 22.4% on 11/20/1995.
FIGURE 7: AIQ, EQUITY CURVE. Here is a sample equity curve for a test system that uses the bull-bear indicator for market timing over the period 1/1/1992 to 6/12/2012. NASDAQ 100 stocks were traded on each buy signal.
The code is also shown below.
!APPLYING THE SECTOR ROTATION MODEL
!Author: Giorgos E. Siligardos, TASC August 2012
!Coded by: Richard Denning 6/6/2012
!www.TradersEdgeSystems.com

!For the US market, the S&P 500 sector exchange traded funds
!(ETFs) or SP500 indexes [IDX] used by author:
 !financial   (XLF) or [SPXF] or [BIX]
 !consumer discretionary (XLY) or [SPXD] or
 !energy   (XLE) or [SPXE] or [OSX]
 !consumer staples  (XLP) or [SPXS] or
 !utilities  (XLU) or [SPXU] or [UTY]
!Other S&P 500 sectors:
 !health care  (XLV) or [SPXA] or [HCX]
 !materials  (XLB) or [SPXM]
 !industrials  (XLI) or [SPXI]
 !telcom   (XLT) or [SPXT]
 !technology  (XLK) or [SPXT]

!INPUTS:
RC_LEN is 95. !LENGTH FOR RATE OF CHANGE
useIDX is 1. !SWITCHES BETWEEN ETF=0 AND IDX=1

!ABBREVIATIONS:
C is [close].

!CUSTOM FORMULAS:
FIN is iff(useIDX=1,TickerUDF("SPXF",C),TickerUDF("XLF",C)).
CDS is iff(useIDX=1,TickerUDF("SPXD",C),TickerUDF("XLY",C)).
ENE is iff(useIDX=1,TickerUDF("SPXE",C),TickerUDF("XLE",C)).
CSP is iff(useIDX=1,TickerUDF("SPXS",C),TickerUDF("XLP",C)).
UTL is iff(useIDX=1,TickerUDF("SPXU",C),TickerUDF("XLU",C)).
HLT is iff(useIDX=1,TickerUDF("SPXA",C),TickerUDF("XLV",C)).
MAT is iff(useIDX=1,TickerUDF("SPXM",C),TickerUDF("XLB",C)).
IND is iff(useIDX=1,TickerUDF("SPXI",C),TickerUDF("XLI",C)).
TEL is iff(useIDX=1,TickerUDF("SPXL",C),TickerUDF("XLI",C)).
TEK is iff(useIDX=1,TickerUDF("SPXT",C),TickerUDF("XLK",C)).
SPX is TickerUDF("SPX",C).

FINrc is (FIN/valresult(FIN,RC_LEN)-1)*100.
CDSrc is (CDS/valresult(CDS,RC_LEN)-1)*100.
ENErc is (ENE/valresult(ENE,RC_LEN)-1)*100.
CSPrc is (CSP/valresult(CSP,RC_LEN)-1)*100.
UTLrc is (UTL/valresult(UTL,RC_LEN)-1)*100.
HLTrc is (HLT/valresult(HLT,RC_LEN)-1)*100.
MATrc is (MAT/valresult(MAT,RC_LEN)-1)*100.
INDrc is (IND/valresult(IND,RC_LEN)-1)*100.
TELrc is (TEL/valresult(TEL,RC_LEN)-1)*100.
TEKrc is (TEK/valresult(TEK,RC_LEN)-1)*100.

BullSR is (FINrc + CDSrc) / 2.
BearSR is (ENErc + CSPrc + UTLrc) / 3.

!PLOT AS HISTORIGRAM:
BullBearOsc is BullSR - BearSR.

!PLOT AS TWO LINE INDICATOR WITH ZERO LINE SUPPORT:
BBavgF is simpleavg(BullBearOsc,50).
BBavgS is simpleavg(BullBearOsc,200).

!REPORTS & TRADING SYSTEM USING THE INDICTOR:
List if 1.
FirstDate is firstdatadate().

HD if hasdatafor(200+10) >= 200.
HDsec if TickerRule("XLF",HD) and TickerRule("XLY",HD)
 and TickerRule("XLE",HD) and TickerRule("XLP",HD)
 and TickerRule("XLU",HD) and TickerRule("SPX",HD).
HDidx if TickerRule("SPXF",HD) and TickerRule("SPXD",HD)
 and TickerRule("SPXE",HD) and TickerRule("SPXS",HD)
 and TickerRule("SPXU",HD) and TickerRule("SPX",HD).
SPXma is simpleavg(SPX,50).
Buy if BBavgF > BBavgS and valrule(BBavgF < BBavgS,1)
 and ((useIDX=1 and HDidx) or (useIDX<>1 and HDsec)).
xBuy if BBavgF < BBavgS and valrule(BBavgF> BBavgS,1)
 or SPXma < valresult(SPXma,10).

!FOR RANKING STOCKS TO TRADE:
StockRC is (C/valresult(TEK,RC_LEN)-1)*100.
—Richard Denning
info@TradersEdgeSystems.com This email address is being protected from spambots. You need JavaScript enabled to view it. for AIQ Systems
Jun 18, 2012 | Uncategorized
The AIQ code for the monthly moving average and related system described in “Trading High-Yield Bonds Using ETFs” by Brooke Gardner in this issue is provided at the website noted below.
Although this is a simple moving average system, the use of the monthly data series presented a challenge, since the EDS module of the AIQ software does not provide access to a monthly bar. The charting module does support the monthly chart, but in the EDS code, the monthly bar cannot be accessed directly.
I tried two different approaches, and both seemed to work. The first one involved creating a monthly data series by downloading a monthly .csv file from Yahoo! Finance and then importing the data file into a newly created ticker using the DTU import utility. This worked but proved to be too much effort if I wanted to get several bond funds. In addition, the update would have to be done manually. To use this data file, we set the input “UseMoDataFile” to 1. Then I tried coding up a monthly close using daily data files. This took a bit of code but any daily data file will work, without modification, with this approach. To use a daily data file, set the “UseMoDataFile” to zero.
The other input parameter allows us to find the end of the month when using a daily data file. As one option, you could use the first day of the new month as the signal day by setting “UseEndOfMonthC” to zero. However, for backtesting and also to match the author’s approach, I set the “UseEndOfMonthC” to “1” so that we get the signals from the last bar of the month. In the EDS file for the backtest, I then enter on the open of the first bar of the month.
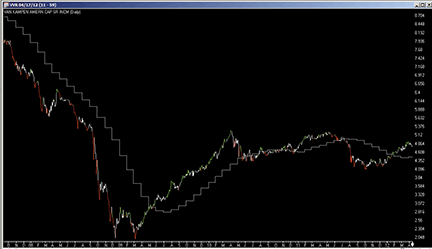
Figure 8 shows a daily chart of VVR with an eight-month moving average.
This code and EDS file can be downloaded from www.TradersEdgeSystems.com/traderstips.htm. (The code is also shown below.
!TRADING HIGH-YIELD BONDS USING ETFs
!Author: Brooke Gardner
!Coded by: Richard Denning 04/17/12
!www.TradersEdgeSystems.com

!INPUTS:
UseMoDataFile is 0.
UseEndOfMonthC is 1.

!ABBREVIATIONS:
C is [close].
O is [open].
C1 is valresult(C,1).
OSD is offsettodate(month(),day(),year()).
SMA8 is simpleavg(C,8).
HD if hasdatafor(21*8+5)>= 21*8.

Mo is month().
Mo1 is valresult(month(),1).
NewMo if Mo <> Mo1.
OneMoBackDate is scanany(NewMo,25,1).
OneMoBackOS is scanany(NewMo,25,1) then OSD.
TwoMoBackOS is scanany(NewMo,25,^OneMoBackOS+1) then OSD.
ThreeMoBackOS is scanany(NewMo,25,^TwoMoBackOS+1) then OSD.
FourMoBackOS is scanany(NewMo,25,^ThreeMoBackOS+1) then OSD.
FiveMoBackOS is scanany(NewMo,25,^FourMoBackOS+1) then OSD.
SixMoBackOS is scanany(NewMo,25,^FiveMoBackOS+1) then OSD.
SevenMoBackOS is scanany(NewMo,25,^SixMoBackOS+1) then OSD.
EightMoBackOS is scanany(NewMo,25,^SevenMoBackOS+1) then OSD.

Cm is iff(UseEndOfMonthC = 1,C1,C).

MonC1 is valresult(Cm,^OneMoBackOS).
MonC2 is valresult(Cm,^TwoMoBackOS).
MonC3 is valresult(Cm,^ThreeMoBackOS).
MonC4 is valresult(Cm,^FourMoBackOS).
MonC5 is valresult(Cm,^FiveMoBackOS).
MonC6 is valresult(Cm,^SixMoBackOS).
MonC7 is valresult(Cm,^SevenMoBackOS).
MonC8 is valresult(Cm,^EightMoBackOS).

Cmo is iff(NewMo,Cm,MonC1).
Cmo1 is iff(NewMo,MonC1,MonC2).
Cmo2 is iff(NewMo,MonC2,MonC3).
Cmo3 is iff(NewMo,MonC3,MonC4).
Cmo4 is iff(NewMo,MonC4,MonC5).
Cmo5 is iff(NewMo,MonC5,MonC6).
Cmo6 is iff(NewMo,MonC6,MonC7).
Cmo7 is iff(NewMo,MonC7,MonC8).

EightMoSMA is iff(UseMoDataFile=0,(Cmo+Cmo1+Cmo2+Cmo3+Cmo4+Cmo5+Cmo6+Cmo7)/8,SMA8).

Buy if Cmo > EightMoSMA and HD.
Sell if Cmo < EightMoSMA and HD.

ListValues if 1.
Jun 12, 2012 | Uncategorized
For the first time Richard Muller, AIQ TradingExpert Pro expert, discretionary trader and former Reuters TV star, will be teaching a full day in person option seminar with LIVE TRADING, June 18th, 2012
We’d kept the details of this unique seminar under wraps, why? Because we limit the number of attendees at all of our events. Small audience equals more personal attention for attendees. We don’t pack 50 in a room it just doesn’t work. Knowing how quickly we’d fill up this exclusive event, we’d decided we weren’t even going to announce the event, and just let word of mouth spread.
Too late now, but the good news is you’re among the first to hear about this full day options training with live trading. So there’s still a chance you can get in and reserve your seat.
Now we know what you’re thinking. Full-day seminar on options training, with live trading, taught by Richard Muller, the Richard Muller, it’s going to cost a bomb. 1995 GBP that’s our regular price for two day seminars, so a one day seminar would have to be at least 900 GBP right? Normally yes. A full day of option training capped with live trading in person with Richard Muller 990 GBP is the going rate.
However, Richard is on fire! When Richard’s on fire, his trading is going well and like any successful trader, he wants to share the secret recipe of his success with other traders.
That’s when Richard dropped the bombshell. 195 GBP, that’s about $300.
Yes you heard correctly 195 GBP for a full day of options training and live trading. That’s it. I think you’ll agree that’s a steal.
There’s only one caveat. When we run out of seats, the offer’s closed. We don’t want more than a dozen or so people, and the places are filling up fast. Act now or you’ll miss out.
P.S.
We don’t know when Richard will repeat this offer again. This could be the only opportunity for a while.
Jun 7, 2012 | Uncategorized
At today’s Market Prism webinar Richard Muller uncovered a host of stock and option plays for the long and short side of the market. Talk about net neutral. Richard also reviewed the prior Market Prism webinars and the short list of candidates he uncovered to see how they were performing. Doing very well was the verdict, even in these difficult market conditions. ****** The option selections were particularly impressive ******
All analysis is undertaken using AIQ TradingExpert Pro. Richard uses Market Timing, Sector and Stock Expert Ratings with Phase confirmation. He uses support and resistance moving averages and trendlines. The Quotes/barometer area is used for his trading list of candidates. He also uses AIQ Reports, the Market Log, Signal Review and more.
Watch the recording at http://connectpro39608568.adobeconnect.com/p6b93r5y7vi/
May 31, 2012 | Uncategorized
If you attended the May 30th Market Prism session, we hoped you gained some insight into the market and possible stock and options setups. If you missed the session, don’t worry, Richard has made available the recording.
In this 40 minute session, Richard covered the big picture market review of the S&P 500, Nasdaq, and the Dow Jones Index. This was followed by Sector rotation review: A detail look at the sectors to spot the ones where there is strength, and weakness.
Click on this link to view the recording http://connectpro39608568.adobeconnect.com/p7fb34oamc9/
May 21, 2012 | Uncategorized
Complimentary access to Richard Muller’s Market Analysis at the Trading Prism webinar Wed May 23rd, 2pm eastern, 7pm London.
Currently Richard Muller is a Proprietary Trader, Senior Instructor at The Trading Prism, and former global equities analyst with Thomson Reuters, where he delivered investment ideas on the Reuters Insider financial TV channel.
Agenda
- Big picture market review of the S&P 500, Nasdaq Comp, and the Dow Jones Index. What the expert ratings are telling us of where the market might be heading next – FREE ACCESS
- Sector rotation review: A detail look at the sectors to spot the ones where there is strength, and weakness – SUBSCRIBER ACCESS ONLY
- Individual stock trading strategies discussed: A look at potential trade ideas to add to your watch list – SUBSCRIBER ACCESS ONLY
- Review of prior weeks potential trade ideas that we added to watch list – SUBSCRIBER ACCESS ONLY
Login information
http://connectpro39608568.adobeconnect.com/marketprism/
Click on this link and login as a guest at 7pm London, 2pm eastern.
May 9, 2012 | Uncategorized
If you attended Richard Muller’s May 9th session, we hoped you gained some insight into the market and possible stock and options setups. If you missed the session, don’t worry, Richard has made available the recording.
In this 70 minute session, Richard covered the big picture market review of the S&P 500, Nasdaq, and the Dow Jones Index. This was followed by Sector rotation review: A detail look at the sectors to spot the ones where there is strength, and weakness. Richard then identified individual stock and option trading ideas.
Click on this link to view the recording http://connectpro39608568.adobeconnect.com/p9dhqqg0sjw/
May 7, 2012 | Uncategorized
Steve Palmquist.
When the market is resting, like it did last week, I set up the alerts function that my broker provides to text my iPhone when the market moves either above or below the resting area. When I get the text message I look at the market to see if trading is warranted. In this case I was notified when the market made a move on Friday. I looked at the market chart on my iPhone, determined that no swing trades were warranted, because I was focused on longs and the market had moved down a bit. This process takes just a few minutes and can be done from almost anywhere; or with a brief break, in most any job. New traders often make this too hard, they want to watch the market all day, afraid they will miss something. Sending the alerts to a cell phone, for both stock triggers and key market levels, allows traders to work on other things and just take a look at the market when something interesting happens. If I am too busy to get to the computer I do not worry about it; any decent move does not require you to be in on the first day, almost by definition. All of my backtesting research for the trading tools I use, and the ones published in my books was done using end of day data; trades were entered at the open the day after the trigger. Again, this illustrates that one does not need to watch the market all day. In fact, it seems that the more people watch the market the worse they do. They start making emotional decisions rather than data based decisions. I am trading patterns in market environments in which they have demonstrated interesting results. There is no emotion in trading a pattern, it is either there or it is not. The stock has either moved above the trigger price, or it has not. The market is either in an appropriate environment for trading or it is not.
Trading should be data driven, not based on emotion, wishful thinking, or hot tips from TV hosts. To be data driven one needs to test and analyze trading tools and find out what really works, and when each tool should be used. Traders must understand which tool to use for a specific task, and have a clear understanding of how the tool works, and what can and cannot be done with it. I have extensively tested several trading systems, the results of this testing on specific trading trading tools are outlined in ‘How to Take Money from the Markets’, and Money-Making Candlestick Patterns. The testing process helps us understand how stocks usually behave after forming a specific pattern such as being outside the Bollinger Bands, showing strong distribution or accumulation, or pulling back or retracing during a trend. Understanding what a stock is most likely to do forms the beginning of a trading strategy. Trading without this information is taking unknown risks.

 English