
As we reach the end of March 2022, the volatility in the markets continues with large range days and varying volume levels.
When the market is in a trend, we might see 2 or 3 high Expert Ratings warning us of a potential change in direction. At the tail end of 2021 and the first 10 days of 2022, we had 3 down signals, the last of the 3 at 1-99 was on 1/10/22. The market moved down solidly to the 33280 level before rallying 2/3rds of the down move.
There was no up rating at the bottom as prices moved back up and one up rating early February that didn’t pan out. However, between 2/24 and 3/16 there was six signals, 5 of them up. That’s in only 14 trading days.
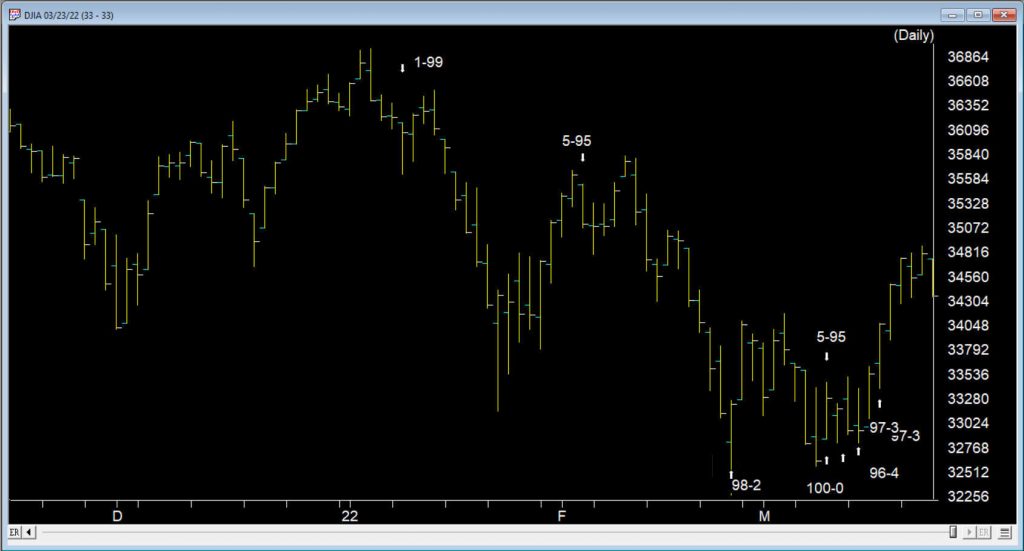
Between the 2/24 up signal and the 3/14 up signal there were 9 distinct bullish ER rules showing. There was also several that were duplicated bullish ER rules. Add to this 4 new distinct ER rules on the up signal 3/16, that adds up to the busiest ER cluster for a very long time.
Here are the first 9 distinct rules contributing the cluster of ratings
- The Money Flow Indicator has reversed and is now advancing. In this sideways market, this is read as a bullish indication that the market could move up from this point because of the inflow of funds.
- The 21 day stochastic has advanced and crossed the 20% line and the price phase indicator is also in- creasing. In this strongly downtrending market this is taken as a strong bullish signal suggesting an increase in prices.
- The price phase indicator is negative but volume accumulation has started to advance. This is a non-conformation that, regardless of the type of market, is a bullish signal which usually results in an upward movement of the market.
- The Money Flow Indicator has reversed and is now advancing. In this downtrending market, this is taken as a weak bullish signal that could indicate an upward movement in the market averages.
- The advance/decline oscillator has turned positive with volume accumulation already positive. In this strong downward trend this is read as a strong non- confirmation of the current trend which could be followed by a reverse in price direction to the upside.
- The new high/new low indicator has reversed to the upside. This is a reliable bullish signal that is often followed by an upward movement in prices. In this strong downtrending market a reverse in trend could start shortly.
- Volume accumulation percentage is increasing and the 21 day stochastic has moved above the 20% line. In this downtrending market, this is taken as a strong bullish signal that could be followed by an upward price movement.
- The new high/new low indicator has reversed to the upside. This is a reliable bullish signal that is often followed by an upward movement in prices. In this weak downtrending market an uptrend could start shortly.
- Intraday low prices of the market have declined to a 21 day low. But the volume accumulation percentage is positive. In this market, this is taken as a weak bullish signal that could be followed by an upward price movement.
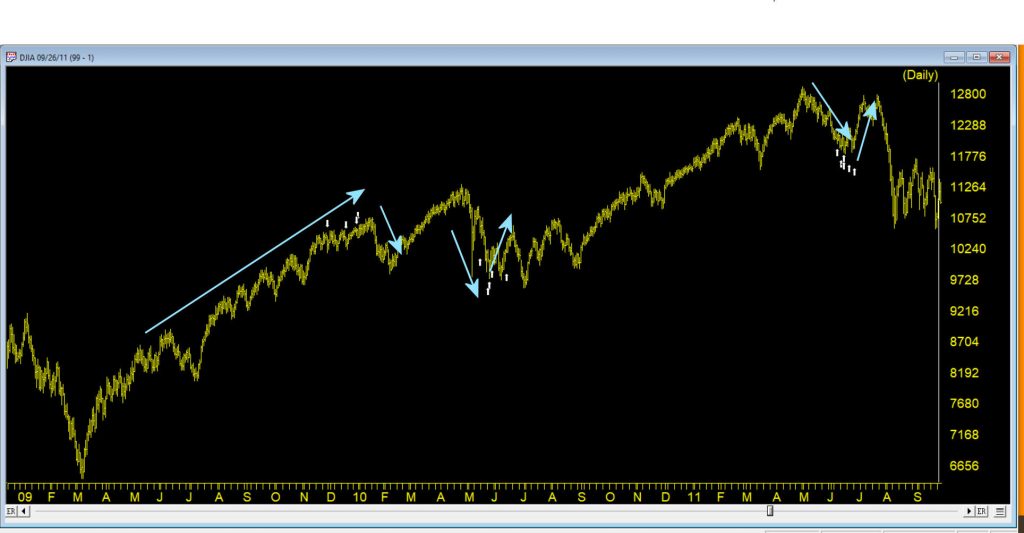
So when was the last time we saw this many ratings so close together?
It happens in clusters particularly in advance of a move against the current trend of the market. The ER system is inherently counter trend. This chart shows some cluster from 2009 – 2011.
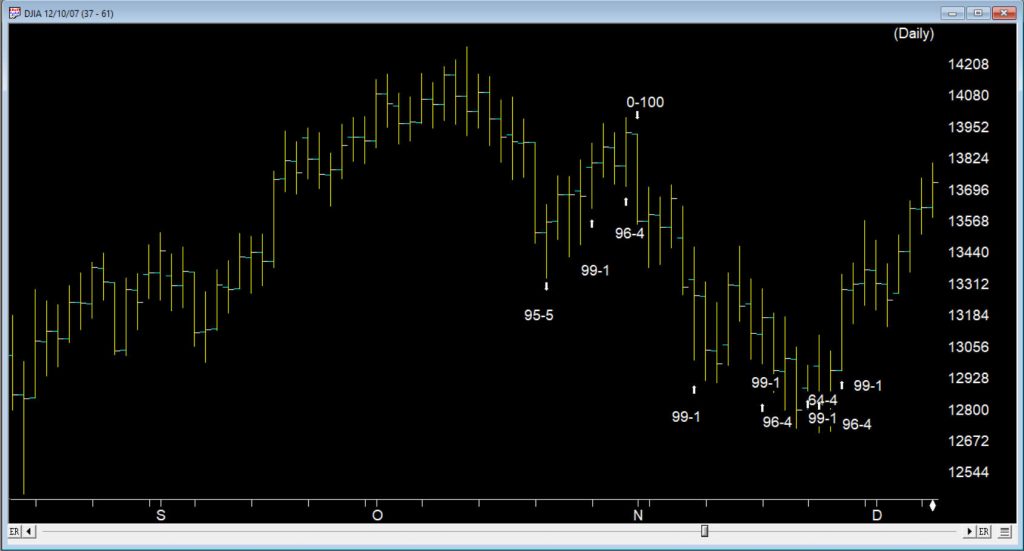
One example was way back at the tail end of 2007, when another cluster of buy signals occurred in a similar fashion. Following a 100 down on 11/01/07 the market gave ground until 11/08/07, the first of 6 buy signals in 13 trading days through to 11/28/07
The market ERs are not perfect but they provide us with key insights into the way the internals are performing.
Where does the market go from here?
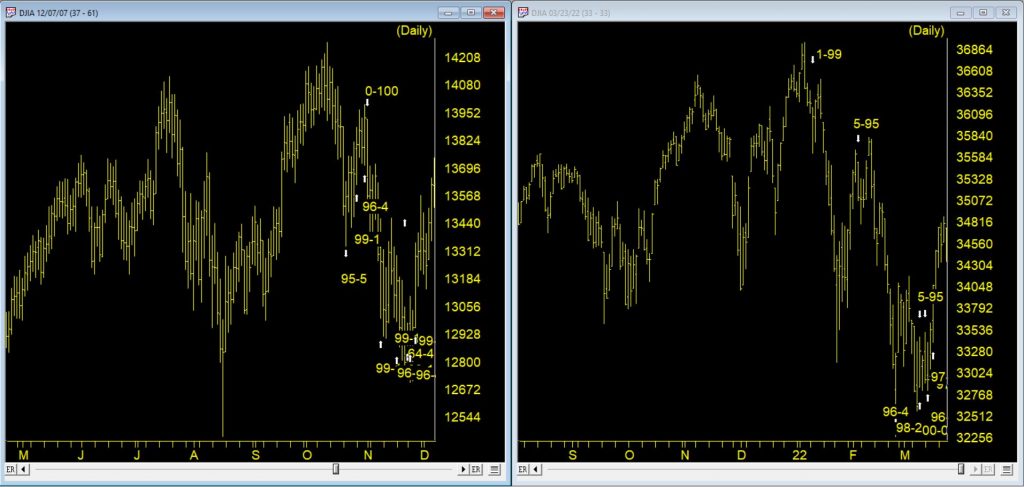
This chart above was back at the start of the 2007/8 bear market. So how do the chart patterns compare between 2022 and 2007/8? The chart below, on the left shows the 2007/8 market through early December 2007 following a strong move up after the cluster of up signals. The right charts shows current market with a strong up move following the cluster of up signals
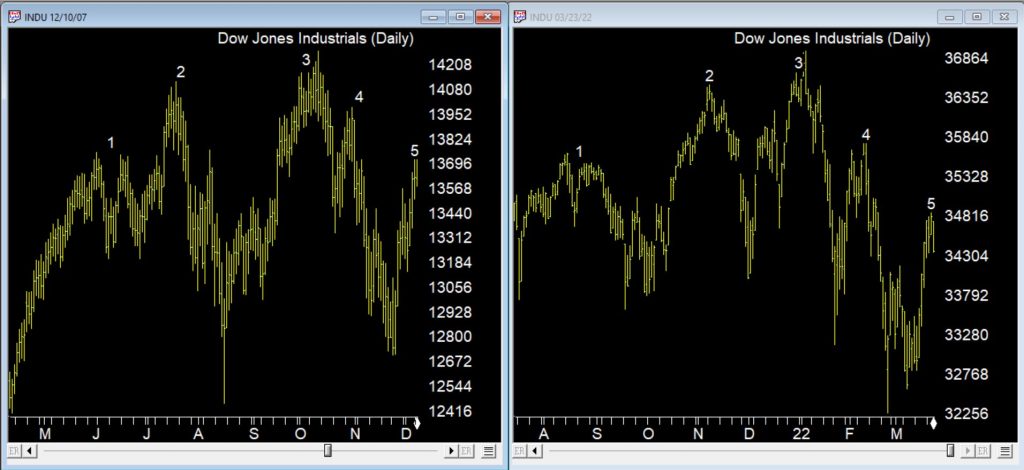
There are some similarities between current price action and the topping pattern back in 2007, one being the measured way this pattern is emerging over several months. The chart below is the same time periods compared but with the ERs showing.
The bear market that followed in 2008 is in the Chart below.
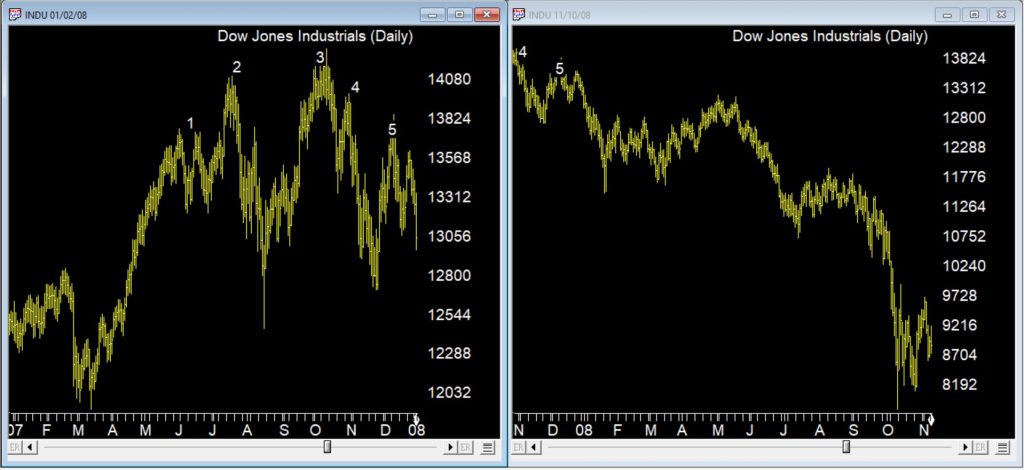
The market moved down in a series of measured moves until we reached late September 2008 and the sharp downturn occurred. No guarantees we’re in the same market, but keep an eye out for those counter trend cluster ERs if we are, they may provide warning of rallies.
WinWay TradingExpert Pro is programmed with the knowledge and insight of respected technical analysts, experts who have developed technical analysis indicators and systems for the last 50 years. The up/down timing signals issued by TradingExpert Pro are based on this knowledge. Since TradingExpert Pro’s timing signals are generated on a scientific basis, free of bias or emotion, you get a disciplined, objective approach to stock market timing.
The timing signals produced by the WinWay expert system are in the form of Expert Ratings. Behind each Expert Rating is a set of rules that combine the sound principles of technical analysis with the experience of market professionals. Since no single technical indicator works all the time, using indicators in combination increases their reliability. For example, a rule is developed that combines the readings of two or more indicators.
This rule is then more reliable than the reading of a single indicator. Within TradingExpert Pro are two knowledge bases, one specifically designed to issue market timing signals and the other designed to issue stock timing signals. Each TradingExpert Pro knowledge base contains approximately 400 rules, but only a few “fire” on any given day.
In the language of expert systems, those rules that are found to be valid on a particular day are described as having “fired”. Rules can fire in opposite directions. When this happens, the bullish and bearish rules fight it out. It’s only when bullish rules dominate that the Expert Rating signal is bullish, or when bearish rules dominate that the Expert Rating signal is bearish.