New to WinWayCharts or a veteran looking for a refresher, this webinar series has something for everyone.
Part 1 of a 3 part webinar series covers all the in depth features analysis and practical application of your WinWayCharts. You’ll be familiar with some of the features and learn how to apply others to your trading.
We’ll be covering in detail the application of some of Darren Winters strategies within the trading software and taking you through some of the powerful tools that will make your analysis easier and save you time.
Learn these Action Strategies for your stock trading
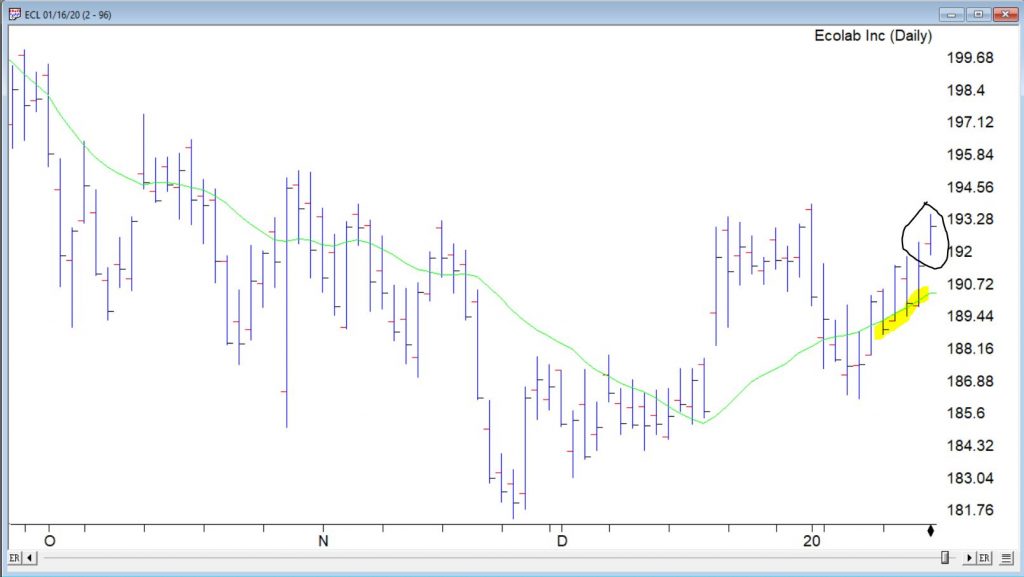
- Moving Average Hug – Works best when end of a downtrend and prices cross over the average and turn up
- Candlestick kicker – a descending pattern that then breaks out – learn how to run this filter every night
- Double top – The double top often occurs at the end of a bull run in a ticker, learn what happens next
- Double bottom – A double bottom is the end formation in a declining ticker. It is identical to the double top, except for the inverse relationship in price
… and these built-in Reports that generate everyday you must use
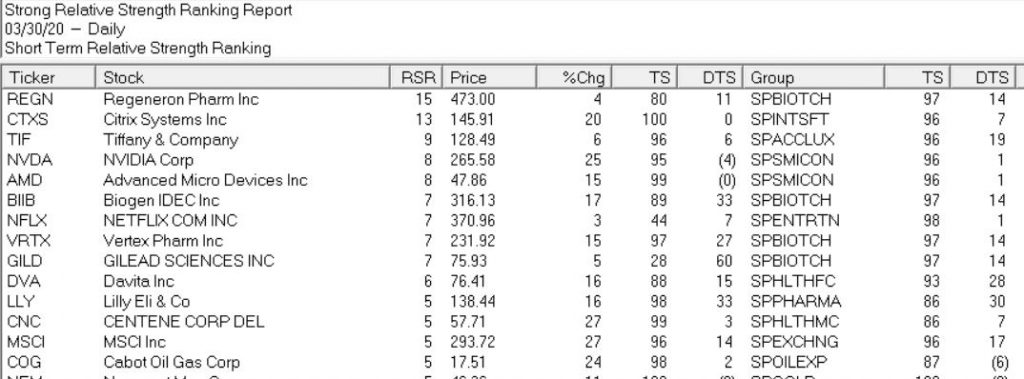
- Relative Strength – Many investors like to buy into a trend and ride that trend higher. The report is generated in two versions. The first version lists stocks showing the greatest relative strength for a Short Term time period. The second version lists stocks showing the greatest relative strength on a Long Term basis. Learn how to use this as part of your trading
- Price Volume Divergence – Discover how this important early signs can help you make successful trading decisions. Positive divergence occurs when the price of a security moves lower at the same time that the security’s technical indicators move higher. Since the indicators often lead price action, a positive divergence is a bullish sign. The opposite is true for a negative divergence
- Volume Spike – A volume spike occurs when volume on a particular day is well above the normal range. This often happens when there is a big news event, if corporate insiders undertake heavy buying or selling of shares, or if a large investor is accumulating the stock. A volume spike does not indicate the direction of a move but it does indicate that a move may occur in the near-term. Actionable or not we’ll show you how to benefit from this report
PLUS Market Timing
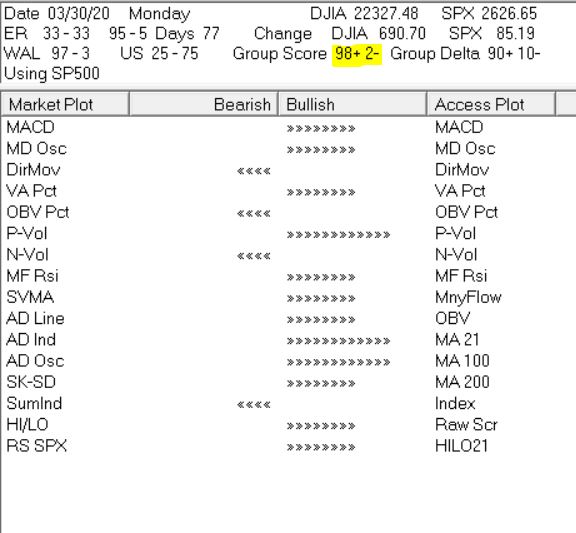
- Market Summary – How the AI Expert Rating up/down and how long Indicators on the market bullish/bearish Group Score + vs –
- Expert Rating – AI for market timing signals with knowledge base of @ 400 rules, but only a few “fire” on any given day.
- AD line – Stocks up for the day vs down for the day, the Advance/Decline Line is a very good indicator of the overall strength of the total market.
- Market HI/LO – The High/Low indicator is an average of stocks reaching new high prices for the year stocks making new low prices for the year.
- Group Score – a trend indicator representative of the general market. The numbers are the percentage of Groups trending up vs the percentage of Groups trending down.
|
Master Trading with WinWayCharts Webinar Series – Part 1
Stock Trading Indicators in Action and Market Timing
April 21, 2020 3.00 – 5.30 pm London time
ONLY $199 includes all handouts in PDF and access to recording

or call 0207-749-2205 Mon-Fri 08:00-4:00pm
ALL 3 webinars package deal (April 21, 28 and May 5) save $120
only $479
