Everybody likes it when an asset that they hold goes up in price. In fact, the more the better. But only to a point as it turns out. When price gets carried away to the upside – we trader types typically refer to it as a “going parabolic”, i.e., a situation when prices are essentially rising straight up – it almost invariably ends very badly. We have seen a couple of examples recently.
Palladium
Palladium is a metal that according to Bloomberg’s “About 85% of palladium ends up in the exhaust systems in cars, where it helps turn toxic pollutants into less-harmful carbon dioxide and water vapor. It is also used in electronics, dentistry, medicine, hydrogen purification, chemical applications, groundwater treatment, and jewelry. Palladium is a key component of fuel cells, which react hydrogen with oxygen to produce electricity, heat, and water.”
And it was pretty hot stuff for some time. At least until it wasn’t. As a proxy we will look at the ETF ticker symbol PALL, which attempts to track the price of palladium.
*From January 2016 into January 2018, PALL rose +139%
*In the next 7 months it declined by -26%
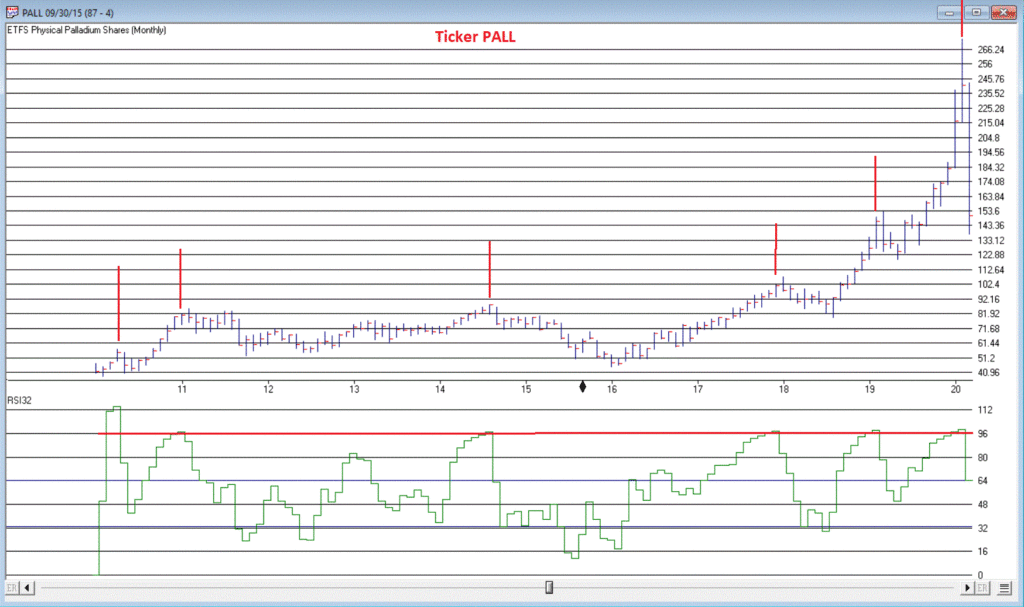
*And then the fun really began – Between August 2018 and February 2020 PALL rose +245%, with a +110% gain occurring in the final 5+ months of the advance
What a time it was. Until it wasn’t anymore.
Since peaking at $273.16 a share on 2/27/2020, PALL plunged -50% in just 12 trading days. To put it another way, it gave back an entire year’s worth of gains in just 12 trading days.
Was there any way to see this coming? Maybe. In Figure 1 we see a monthly chart with an indicator called “RSI32” in the bottom clip. This indicator is derived by taking the 2-month average of the standard 3-month Relative Strength Index (RSI).

Figure 1 – PALL with RSI32 (Courtesy WinWayCharts TradingExpert)
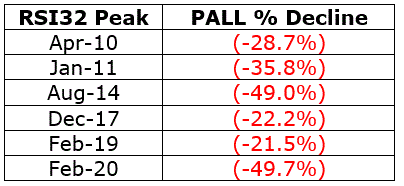
Notice that historically when the RSI32 indicator gets above 96, trouble tends to follow pretty quickly. See Figure 2

Figure 2 – PALL: Peaks in RSI32 and the subsequent maximum drawdown (Courtesy WinWayCharts TradingExpert)
T-Bonds
During the panic sell-off in the stock market in recent weeks, treasury bonds became very popular as a “safe haven” as investors piled out of stocks and into the “safety” of U.S. Treasuries. What too many investors appeared to forget in their haste was that long-term treasury can be extremely volatile (for the record, short and intermediate term treasuries are much less volatile than long-term bonds and are much better suited to act as a safe haven). Likewise – just an opinion – buying a 30-year bond paying 1% per year is not entirely unlike buying a stock index fund when the market P/E Ratio is over 30 – there just isn’t a lot of underlying value there. So you are essentially betting on a continuation of the current trend and NOT on the ultimate realization of the underlying value – because there really isn’t any.
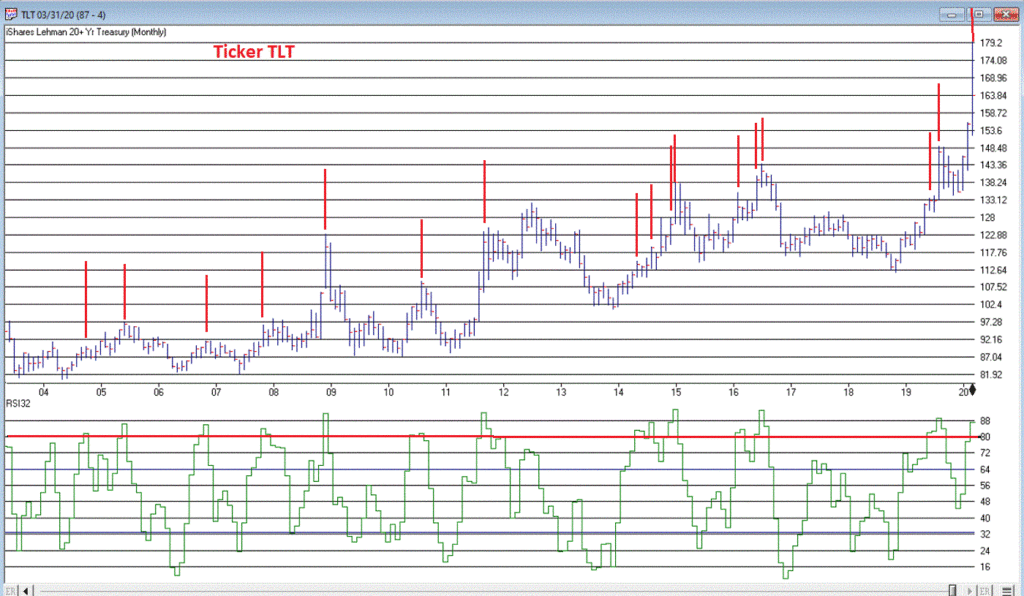
Anyway, Figure 3 displays a monthly chart of ticker TLT – an ETF that tracks the long-term treasury – with the RSI32 indicator in the bottom clip.

Figure 3 – TLT with RSI32 (Courtesy WinWayCharts TradingExpert)
Bond price movement is typically not as extreme and volatile as Palladium, so for bonds a RSI32 reading above 80 typically indicates that potential trouble may lie ahead.
As of the close of 3/17/20, TLT was almost -15% off of its high in just 6 trading days. We’ll see where it goes from here.
Tesla (Ticker TSLA)
Anytime you see what is essentially a manufacturing company – no matter how “hot”, “hip”, or “cool” the product they build – go up 200% in 2 months’ time, the proper response is NOT giddy delight. The proper response is:
*If you DO own the stock, either set a trailing stop or take some profits immediately and set a trailing stop for the rest
*If you DO NOT own the stock, DO NOT allow yourself to get sucked in
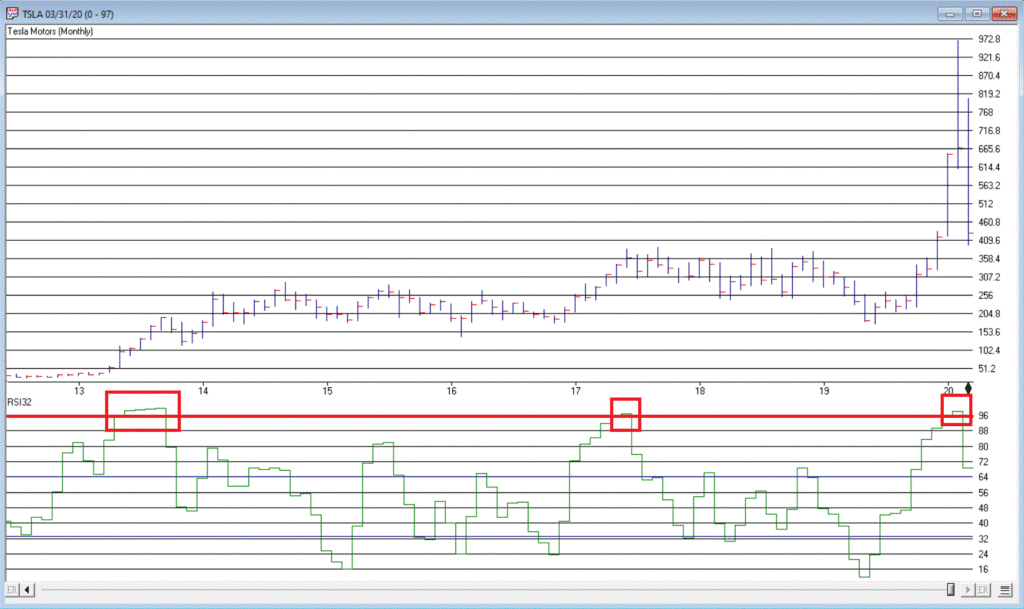
Take TSLA in Figure 4 for instance. By February 2020 TSLA was up almost 200% in 2 months and almost 450% in 8 months. The RSI32 indicator was above 96 – a stark warning sign.
19 trading days after making its closing high, TSLA is down -59%.

Figure 4 – TSLA with RSI32 (Courtesy WinWayCharts TradingExpert)
Summary
Simply remember this. Parabolic price moves are:
*Exciting while they are unfolding
*Disastrous when they end
Typically, the security in question gives back months – or in some case, years – worth of gains in a shockingly short period of time.
Beware the parabola.
Jay Kaeppel
Disclaimer: The information, opinions and ideas expressed herein are for informational and educational purposes only and are based on research conducted and presented solely by the author. The information presented does not represent the views of the author only and does not constitute a complete description of any investment service. In addition, nothing presented herein should be construed as investment advice, as an advertisement or offering of investment advisory services, or as an offer to sell or a solicitation to buy any security. The data presented herein were obtained from various third-party sources. While the data is believed to be reliable, no representation is made as to, and no responsibility, warranty or liability is accepted for the accuracy or completeness of such information. International investments are subject to additional risks such as currency fluctuations, political instability and the potential for illiquid markets. Past performance is no guarantee of future results. There is risk of loss in all trading. Back tested performance does not represent actual performance and should not be interpreted as an indication of such performance. Also, back tested performance results have certain inherent limitations and differs from actual performance because it is achieved with the benefit of hindsight.
