
By Steve Hill
Founder, WinWayCharts
Stephen Hill is Founder of WinWayCharts. For the past 12 years he has been involved in all aspects of WinWayCharts, from support and sales to programming and education. Steve is a frequent speaker at events in the U.S. and Europe, talking on subjects as diverse as Portfolio Simulation Techniques, Advanced Chart Pattern Analysis and Trading System Design.
Chart pattern analysis, often thought of as part science part art is a key element in many traders decision process. Common patterns like double tops and bottoms are somewhat self-fulfilling, given that most of us can see these patterns occurring. Measures of what constitutes a double top or bottom in good analytical terms we’ll save for another article. In this this article we are focussing on two of my favorite chart patterns; Flags and Pennants
Flags and Pennants are Consolidation or Continuation Patterns
These patterns break out in the direction of the previous trend, confirming the existing trend, suggesting that investors are considering whether the market is overbought or oversold but ultimately deciding to confirm the existing trend. Flags and pennants are of two types, bullish or bearish
Flags and pennants are generally considered continuation patterns as they breakout in the prevailing trend direction. They represent a brief pause especially after a steep run up in an active ticker. They are a fairly common and useful for short term trading.
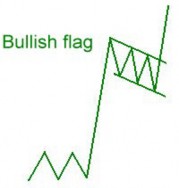
Bullish Flags – formation
Lower tops and lower bottoms bounded by two parallel trendlines with pattern slanting against the prevailing trend are considered bull flags (figure 1).
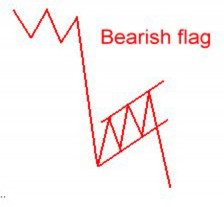
Bearish Flags – formation
Higher tops and higher bottoms bounded by two parallel trendlines with pattern slanting against the prevailing trend are considered bear flags. (figure 2).
Elements of bullish flags
- A rapid and steep price rise of around 20% from bottom of the pole to top.
- Decreasing volume during the formation of the flag.
- Breakout occurs to the upside with resumption of increase volume levels
- Flags length excluding the pole classic should be around 10 days, can be less but not more than 20 days.
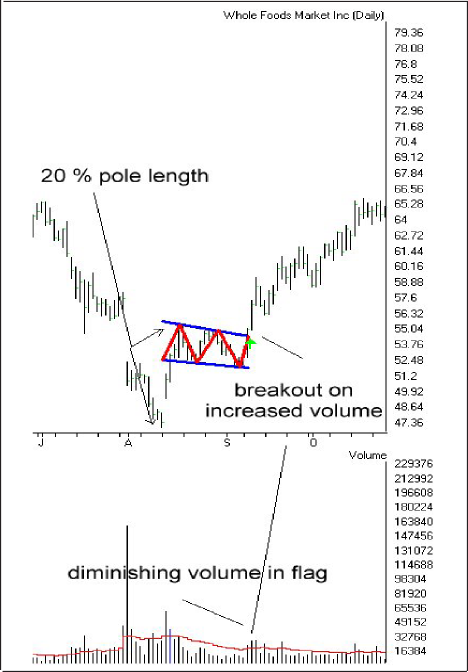
Bulkowski noted that the high and tight flag performed best. (source Encyclodpedia of Chart Patterns by Thomas Bulkowski).
Some 25% of the patterns are horizontal notes Markos Katsanos. (source Measuring Flags & Pennants: Technical Analysis of Stocks and Commodities vol 23 no 4) bullish flag breakout on increased volume note the pole length is 20% + of the price action and the diminishing volume on the flag.
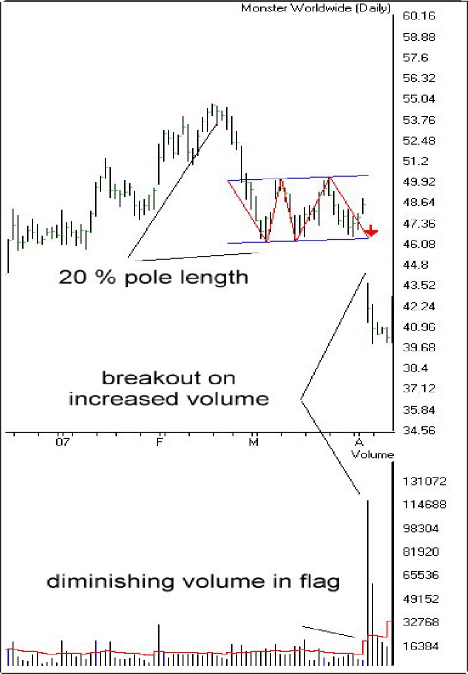
Elements of bearish flags
- A rapid and steep price decline of around 20% from top of the pole to bottom.
- Decreasing volume during the formation of the flag.
- Breakout occurs to the downside with resumption of increase volume levels.
- Flag length excluding the pole should be around 10 days, can be less but not more than 20 days.
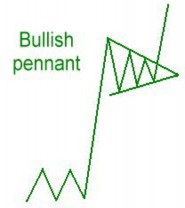
Bullish Pennants – formation
Pennants look very much like symmetrical triangles, on the end of a pole, typically they are smaller in size and duration (figure 5).
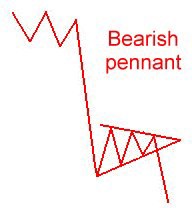
Bearish Pennants – formation
An upside down bullish pennant, the triangle is at the bottom of the pole. (figure 6).
Elements of bullish pennants
- A rapid and steep price rise of around 20% from bottom of the pole to top.
- Decreasing volume during the formation of the pennant.
- Pennants look like symmetrical triangles on a pole, price action is converging.
- Diminishing volume as pennant forms.
- Breakout to the upside with re- sumption of volume levels.
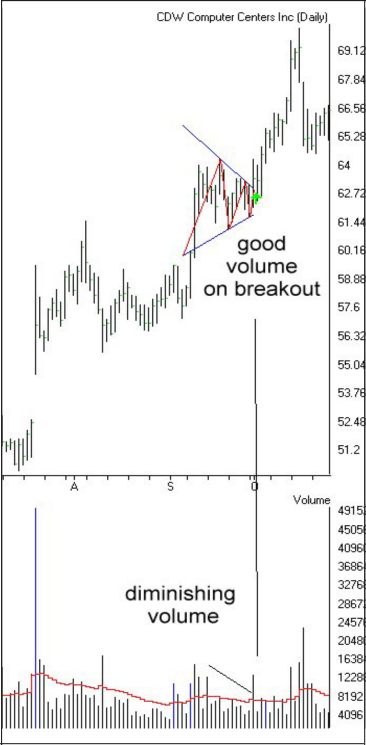
- Pennant length excluding the pole should be around 10 days, can be less but not more than 20 days.Figure 7 shows CDW classic bullish pennant breakout on increased volume
Elements of bearish pennants
- A rapid and steep price drop of around 20% from top of the pole to bottom.
- Decreasing volume during the formation of the pennant.
- Pennants look like symmetrical triangles on a pole, price action is converging.
- Diminishing volume as pennant forms.
- Breakout to the downside with resumption of volume levels.
- Pennant length excluding the pole should be around 10 days, can be less but not more than 20 days.
How do you trade flags and pennants?
Katsanos study of Flags and pennants revealed that the average breakout was 45% over an average period of 11 days. Bulkowski noted a 63% average gain. to trade these breakouts, set tight stops at low of day before breakout and use trailing stops once breakout occurs.
Target prices are more difficult to predict as these are continuation patterns, but after 11 days you are beyond the average move in days.
AIQ tip
Once a breakout occurs, use AIQ space on right of the chart (rtalerts only) and advance 11 days into the future. Draw a trendline parallel to the pole trend from the breakout point.