Dec 1, 2017 | EDS, EDS code, trading strategies, trading strategy
The Expert Design Studio code for Jerry D’Ambrosio and Barbara Star’s article, “A Candlestick Strategy With Soldiers And Crows,” in Stocks & Commodities October 2018 issue is shown below.”Among the more well-known candlestick reversal patterns are soldiers and crows. These occur in a three-candle pattern such as three white soldiers or three black crows. Recently, on the website Candlesticker.com, we learned of two other candle reversal patterns—a bullish one white soldier and a bearish one black crow—that require fewer candles. ”
!A CANDLESTICK STRATEGY WITH SOLDIERS AND CROWS
!Author: Jerry D'Ambrosio & Barbara Star, TASC Oct 2017
!Coded by: Richard Denning 8/05/2017
!www.TradersEdgeSystems.com

!CODING ABBREVIATIONS:
O is [open].
O1 is valresult(O,1).
C is [close].
C1 is valresult(C,1).
C2 is valresult(C,2).
H is [high].
L is [low].
V is [volume].

!INPUTS:
minPriceBull is 1.
minPriceBear is 10.
minVolume is 1000. !in hundreds
volAvgLen is 50.
dayCount is 5.
longExitBars is 7.
shortExitBars is 1.

okToBuy if simpleavg(C,50) > simpleavg(C,200) or CminPriceBull and simpleavg(V,volAvgLen)>minVolume.
BullWS if C1C1 and C>O1 and O= longExitBars.

okToSell if simpleavg(C,50) < simpleavg(C,200) or C>simpleavg(C,200)*1.1.
okToSellMkt if TickerRule("SPX",okToSell).
PVfilterBear if C>minPriceBear and simpleavg(V,volAvgLen).
BearBC if C1>C2 and C1>O1
     and OO1
     and countof(C1>C2,dayCount)=dayCount
     and PVfilterBear and okToSellMkt.
ExitShort if {position days} >= shortExitBars.
I ran several backtests using the NASDAQ 100 list of stocks over the period from 8/04/2000 to 8/04/2017. I varied the following inputs to find the optimum set of parameters for the candlestick patterns. For longs, the “dayCount” = 5 with an “longExitBars” = 7 produced the best results, which is shown in Figure 5. For shorts, the “dayCount” = 5 with a “shortExitBars” = 1 produced the best results, which is shown in Figure 6. Neither commission nor slippage were subtracted from the results.

FIGURE 5: WINWAY. EDS summary report for longs only.

FIGURE 6: WINWAY. EDS summary report for shorts only.
Dec 8, 2016 | bonds, educational newsletters, ETFs, jay kaeppel, trading strategy
If you have read any of my stuff in the past then you probably know that I spend a lot of time trying to determine “what goes up (or down) when”. What follows are the results of one such test.
While the results are initially impressive on the face of it (if I do so say myself, and I think I just did) there are a number of important caveats. To put it another way, do NOT be impressed with the results WITHOUT first seriously considering some of the significant caveats mentioned below. To put it in the most standard terms possible – past results DO NOT guarantee future results.
The Test
*I looked at variety of assets classes (listed at the end of the article) using mutual fund data and/or index data from January 1993 through April 2007. The data was monthly total return data from Callan Associates.
*I’ve created my own proprietary formula for measuring performance during a specific month. The factors include: average monthly return, median monthly return, standard deviation, largest monthly decline and a variety of ratios amongst these factors (but I am a lot of fun at parties. No seriously.)
*I used my proprietary formula to rank performance for each asset class for each month and took my “top pick”. In a nutshell, the “top pick” is not the one that showed the largest average monthly gain but the one that showed the best tradeoff between risk and reward.
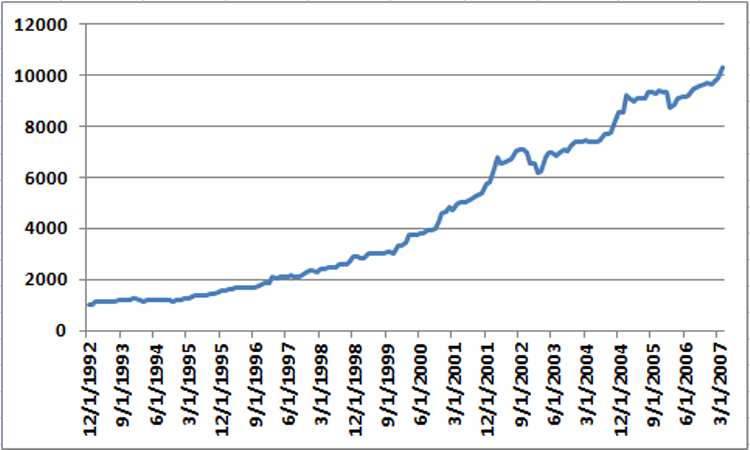
*I ran a backtest using mutual fund and/or index data for the top ranked asset for each month from January 1993 through May 2007. The results for Jay’s One Asset Class per Month strategy (heretofore JOAC) appear in Figure 1.
Figure 1 – Equity Curve for Jay’s One Asset Class per Month Strategy; 12/31/92-5/31/2007
The average 12-month return was +17.8% and the maximum drawdown (using month-end data) was -12.7%
While the results look good it is now time for those dreaded “caveats”:
*These results could not be exactly duplicated in real trading for a couple of reasons: First, some of the results were generated using index data and not mutual fund data.
*Also, many of the mutual funds used in the test (particularly Vanguard and Fidelity funds) cannot be traded one month at a time. Most have a minimum holding period of 30 to 90 calendar days). So buying in one month and selling out the next would likely result in fees and/or future trading restrictions.
Moving Forward JOAC using ETFs
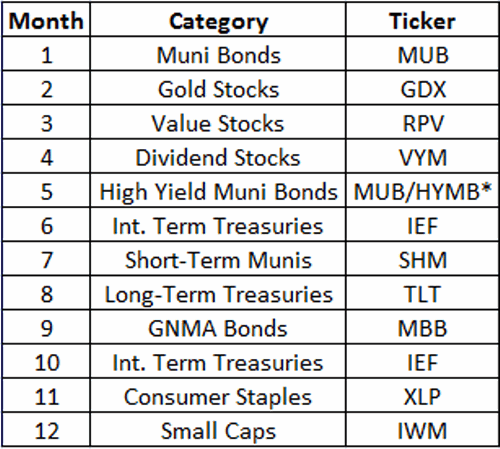
ETFs have no switching restrictions so starting in May 2007 I switched to an all ETF portfolio, using a particular ETF each month to attempt to track the top asset class for that month. That portfolio appears in Figure 2.
Figure 2 – JOAC monthly ETF Portfolio
*-MUB traded in May 2007-2010; HYMB traded in May starting in 2011
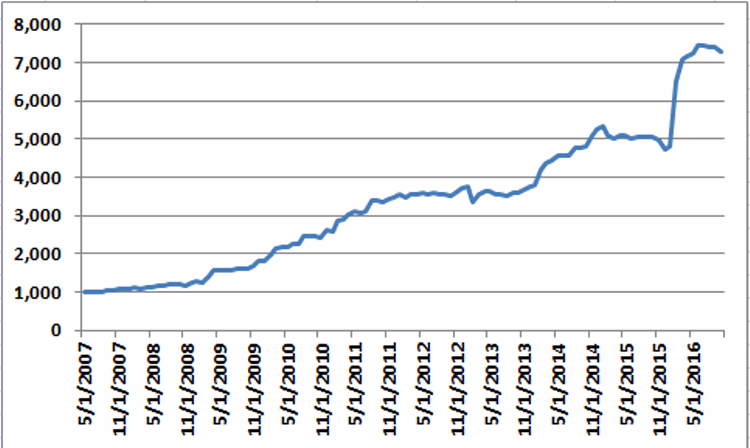
Once again using monthly total return data from Callan Associates I tested the 2007-2016 period using the tickers listed in Figure 2. The results appear in Figure 3.
Figure 3 – Equity Curve for Jay’s One Asset Class per Month Strategy; 5/31/2007-10/31/2016
*The average annual gain starting in 2008 (the 1st full year of data) is +25.8%
*The maximum drawdown (using monthly data) is -11%.
Annual results in appear in Figure 4. These results do not include any transaction fees
Figure 4 – JOAC ETF Strategy Annual Results
*May 31st/2007-12/31/2007
So is this the greatest thing since sliced bread? Probably not. Why not? Time for more of those pesky caveats:
*Buying and holding only one ETF per month does not offer a lot of diversification (or any diversification at all for that matter)
*The test period using ETFs is relatively short
*Intramonth volatility and drawdowns will undoubtedly be greater than what appears in the Figures above
This strategy fits squarely in the “(almost certainly) high risk, (potentially) high reward” category.
Summary
So as I stated earlier, no one should assume that they can just start buying the ETFs listed above and start making 25% a year ad infinitum into the future. The results displayed in this article should probably be thought of more as a starting point for further analysis rather than a finished product.
In essence, the real point is that – as with all things – there is a time and a place or everything, including (apparently) asset classes.
Aug 23, 2016 | educational newsletters, jay kaeppel, seasonal, trading strategy
Some days are just better than others – am I right or am I right? As a corollary, some days are worse than others. Wouldn’t it be nice to know in advance which days were going to be which?
Well, when it comes to the stock market, maybe you can.
The 3 Days to Miss
For our purposes we will refer to the very last trading day of the month as TDM -1. The day before that will be TDM -2, the one before that TDM -3, etc. Now let’s focus specifically on TDMs -7, -6 and -5.
Let’s now assume that we will buy and hold the Dow Jones Industrials Average every day of every month EXCEPT for those three days – i.e., we will sell at the close of TDM -8 every single month and buy back in 3 days later. We will refer to this as Jay’s -765 Method. Granted some may not be comfortable trading this often, but before dismissing the idea please consider the results.
Figure 1 displays the growth of $1,000 invested in the Dow as described above versus the growth of $1,000 from buying and holding the Dow.
*The starting date for this test is 12/1/1933.
*For this test no interest is assumed on the 3 days a month spent out of the market.

Figure 1 – Growth of $1,000 invested in Dow Industrials during all days EXCEPT TDM -7,TDM -6 and TDM -5 (blue line) versus $1,000 invested in Dow Industrials using buy-and-hold (red line); 12/1/1933-8/15/2016
For the record:
*Jay’s -765 Method gained +94,190%
*The Dow buy-and-hold gained +18,745%
While these results are compelling, the real “Wow” comes from looking at would have happened if you had been long the Dow ONLY on TDMs -7,-6 and -5 every month since 1933. These results appear in Figure 2 (but you’d better brace yourself before taking a glance).

Figure 2 – Growth of $1,000 invested in the Dow ONLY on the 7th to last, 6th to last and 5th to last trading days of every month since 12/1/1933
The net result is an almost unrelenting 83 year decline of -80%.
Summary
I would guess that some readers would like me to offer a detailed and logical reason as to why this works. Unfortunately, I will have to go with my stock answer of “It beats me.” Of course, as a proud graduate of “The School of Whatever Works” (Team Cheer: “Whatever!”) I am not as interested in the “Why” of things as I am the “How Much.”
Sorry, it’s just my nature.
Jay Kaeppel
Jul 29, 2016 | educational newsletters, ETFs, jay kaeppel, trading strategy
It pains me to say that I don’t know where the stock market is going next. You would think that after being in the markets for so long and following a bunch of indicators and systems etc., that by now I would have developed some ability to divine what is coming next.
Alas, I have not.
But I do know three things:
*My trend-following stuff is bullish so I need to give the bullish case the benefit of the doubt (no matter how nervous or cynical I may be).
*Based on a variety of indicators the market is certainly getting overbought
So, a thought today for those who might be wishing to hedge away some of their market risk.
Ticker TZA
Ticker TZA is not necessarily one of my favorites. It is an ETF that tracks 3 times the inverse of the Russell 2000 small-cap index. In other words, if ticker RUT falls 1% today then TZA should rise 3%. There are two primary concerns to keep in mind before considering buying shares of TZA are:
*The shares are extremely volatile
*The shares have experienced a serious downside bias – even when RUT is headed sideways (See Figure 1).
Figure 1 – Ticker TZA (black bars) versus Ticker RUT (Russell 2000) (Courtesy
AIQ TradingExpert)
So if you are going to buy TZA you’d better pick your spots. As I discussed here we are entering an “interesting” time for the market. So let’s explore the possibility of buying a call option on ticker TZA as a hedge against a potential market decline.
Call Option on TZA
Remember, TZA should increase in value if the Russell 2000 declines. Therefore, a call option on TZA should also increase in value if the Russell 2000 declines.
As you can see in Figure 2, the “implied volatility” (which generally tells you whether there is a lot of time premium built into the price of the options for a given security) for options on TZA is near the low end of the historical range. This tells us that there is relatively little time premium built into TZA options, therefore they are “cheap”.
Figure 2 – Implied option volatility for options on TA near the low end of the historical range (Courtesy
www.OptionsAnalysis.com)
Next I ran the “Percent to Double” routine in
www.OptionsAnalysis.com (see output in Figure 3. The phrase “percent to double” tells us what percentage the underlying stock must rise in order for the call option to double in price.
Figure 3 – Percent to Double routine suggests buying Sep30 TZA call which will double in price if TZA rises 12.56% (i.e., if RUT declines by roughly -4.19%) (Courtesy
www.OptionsAnalysis.com)
Figures 4 and 5 display the particulars and risk curves for buying 10 TZA Sep 30 calls.
A few things to note:
*The cost to buy 10 is $2,550.
*TZA is trading at $30.25/share.
*The breakeven price for this trade is $32.25 (if TZA is below $32.25 at expiration and we still hold this position then we will lose -$2,250)
*There are 50 days left until September expiration
*The trade has unlimited profit potential
Regarding potential, in Figure 6 we see that if TZA rallies back to its June low of $33.77 this trade will generate a profit of between $1,500 and $2,400 depending on how soon that price is reached
Summary
Is this a good trade? I can’t say for sure that it is. In fact, the only way this trade makes money is if the broader market suffers a hit, so a good part of me would prefer to see this trade “not work out”.
But the point of all of this is simply to point out that it is possible to hedge against a significant market decline by buying call options on an inverse leveraged ETF.
Mr. Market, you take it from here.
Jay Kaeppel


