
Reversing the MACD: The Sequel
In “Reversing MACD: The Sequel” in the November 2013 issue of Stocks and Commodities, author Johnny Dough presents functions that return price values for the MACD indicators. I am providing AIQ code for the following functions based on the AmiBroker code given in Dough’s article:
- PMACDsignal returns price where the MACD crosses its signal line or where there is an MACD histogram cross of the zero line
- PMACDlevel returns price where the MACD is equal to the level value
- PMACDeq returns price where the MACD is equal to the previous bar MACD.
I created some additional rules to show reports that display the price values of the functions:
- The ShowValues rule will display all function values for stocks that are over the minPrice level input
- The NearXO rule will list only those stocks that are less than or equal to the average range percentage of crossing over of the MACD oscillator
- The PMACxup rule lists cross-ups today on the MACD oscillator using the PMACDsignal price
- The PMACxdn “if” rule lists cross-downs today on the MACD oscillator using the PMACDsignal price.
The NearXO report is useful if you want to enter a position on a buy or sell stop-on-close when the MACD oscillator crosses zero. This report sorts by the MACD oscillator. The ones with a positive MACD oscillator amounts calculate the price that would be used to go short at the close for a cross-down on the oscillator. The ones with negative MACD oscillator amounts calculate the price that would be used to go long at the close for a cross-up on the oscillator.
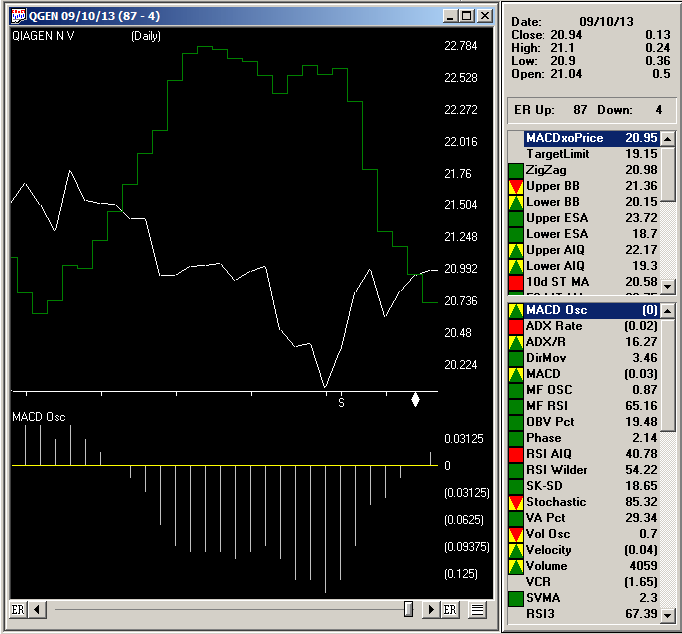
I ran the NearXO report on September 10, 2013 using the NASDAQ 100 list of stocks. There were 12 that showed up on the report, meaning they were near a cross-up or cross-down of the MACD oscillator.
In Figure 5, I show a chart of Qiagen NV (QGEN), which appeared on the report. The report showed that a next day’s close price of 20.72 or higher would cause the MACD oscillator to go from negative to positive. On September 11, 2013, QGEN closed at 20.98 and the MACD oscillator moves to a positive number.
The AIQ code and EDS file can be downloaded from www.TradersEdgeSystems.com/traderstips.htm.
!REVERSING MACD: THE SEQUEL
!Author: Johnny Dough, TASC November 2013
!Coded by: Richard Denning 9/9/2013
!www.TradersEdgeSystems.com
!INPUTS:
price is [close].
period_X is 12.
period_Y is 25.
period_Z is 9.
level is 0.
minPrice is 10.
rangeFactor is 1.
!PMACDsignal returns price where MACD crosses signal line
! or MACD histogram cross of 0:
alphaX is 2 / ( 1 + period_X ).
alphaY is 2 / ( 1 + period_Y ).
alphaZ is 2 / ( 1 + period_Z ).
One_alphaX is 1 – alphaX.
One_alphaY is 1 – alphaY.
One_alphaZ is 1 – alphaZ.
MACDvalue is expavg( price, period_X ) – expavg( price, period_Y ).
MACDvalue_1 is valresult(MACDvalue,1).
MACDsignal is expavg( MACDvalue, period_Z ).
PMACDsignal is ( MACDsignal – expavg( price, period_X ) * one_alphaX
+ expavg( price, period_Y ) * one_alphaY ) / ( alphaX – alphaY ).
!PMACDlevel returns price where MACD is equal to level value
! e.g. PMACDlevel(0, C, 12, 16) would return the series
! where next price would make MACD=0
PMACDlevel is (Level + expavg( price, period_Y ) * one_alphaY
– expavg( price, period_X )* one_alphaX ) / ( alphaX – alphaY ).
!PMACDeq returns price where MACD is equal to previous bar MACD
PMACDeq is ( expavg( price, period_X ) * alphaX
– expavg( price, period_Y )* alphaY ) / ( alphaX – alphaY ).
!ADDITIONAL CODE NOT PROVIDED BY AUTHOR:
PMACDsignal_1 is valresult(PMACDsignal,1). !PLOT-OFFSET BY ONE DAY
MACDosc_1 is val([MACD osc],1). !Prior day’s MACD oscillator value
!RULES FOR GENERATING REPORTS:
PMACxup if price > PMACDsignal_1
and valrule(price <= PMACDsignal_1,1) and price > minPrice.
PMACxdn if price < PMACDsignal_1
and valrule(price >= PMACDsignal_1,1) and price > minPrice.
PMACDsigPct is (PMACDsignal / [close] – 1) * 100.
AvgRangePct is simpleavg(([high]/[low]-1)*100,200).
NearXO if price > minPrice and abs(PMACDsigPct) <= AvgRangePct*rangeFactor.
ShowValues if price > minPrice.
—Richard Denning
info@TradersEdgeSystems.com
for AIQ Systems